
E.Nourddine
-
المساهمات
1458 -
تاريخ الانضمام
-
تاريخ آخر زيارة
-
عدد الأيام التي تصدر بها
18
نوع المحتوى
ريادة الأعمال
البرمجة
التصميم
DevOps
التسويق والمبيعات
العمل الحر
البرامج والتطبيقات
آخر التحديثات
قصص نجاح
أسئلة وأجوبة
كتب
دورات
كل منشورات العضو E.Nourddine
-
Laravel سيعتمد على المسار الخاص بالدالة UpdateCountry، وبالمقابل فإنك لم تخصص أي مصار لهذه الدالة. في الكود الخاص بك، يتم الاتصال بـ SaveChanges والتي تعيد Redirect، لكنها لا تعيد أي قيمة من خلال UpdateCountry. لذا وجب الرجوع بقيم عند استعمال Rdirect عند UpdateCountry. سيكون الحل بتغيير كود UpdateCountry إلى الآتي: public function UpdateCountry(\App\Http\Requests\CountryRequest $request) { return $this->SaveChanges($request); }
-
الدالة WhereIn تقبل mixed/array أي بإمكانك استعمالها عوض Where في الكود الخاص بك، على الشكل التالي: $event = \App\Events::whereIn('event_id',$request->input('event_name'))->get(); ليصبح الكود كالتالي: public function generate(Requests\Generate $request) { $event_id = implode(",", $request->input('event_name')); $event = \App\Events::whereIn('event_id',$request->input('event_name'))->get(); } والملفين الآخرين، دون تغيير: @foreach ($events as $events) <tr> <td>{{$events->Name}}</td> <td>{{$events->Summary}}</td> <td class="select_event">{!! Form::checkbox('event_name[]', $events->Event_ID) !!}</td> </tr> @endforeach ثم: public function index() { $events = Events::all(); $user = Auth::user()->name; $id = 1; return view('Delta.Index')->with([ 'user' => $user, 'events' => $events, 'id' => $id, ]); }
-
لحل المشكل، عليك بإضافة الرمز "`"، لأن للاسم فقط إمكانية احتواء الأرقام، لذا وجب إضافة علامة الترميز "`" بجانبي الاسم لتفادي أي مشكل، لتصبح جملة الاستعلام كالتالي: $sql="update mark_list set `".$_SESSION['question_id']."` ='2' where user_id= ".$_SESSION['user_id']; مثال: ننشئ جدول على Mysql: CREATE TABLE `a``b` (`c"d` INT); جملة استعلام لتحديد بيانات: mysql> SELECT 1 AS `one`, 2 AS 'two'; +-----+-----+ | one | two | +-----+-----+ | 1 | 2 | +-----+-----+ يمكنك الرجوع إلى الرابط من الموقع الرسمي لـ Mysql.
-
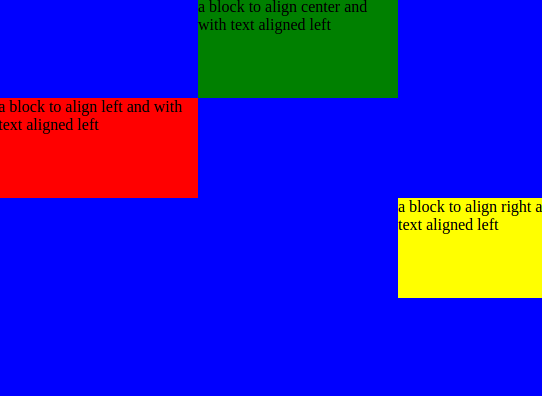
لكي يتموضع العنصر وسط الوسم div والذي يعتبر العنصر الأب في هذه الحالة، عليك بإضافة الخاصية text-align:center إلى العنصر div و margin:auto إلى العنصر الإبن. هذا مثال تطبيقي يشرح كيفية فعل ذلك: صفحة html تضم div مع id بقيمةparent، مع 3 عناصر : <div id="parent"> <div id="child1" class="block center">a block to align center and with text aligned left</div> <div id="child2" class="block left">a block to align left and with text aligned left</div> <div id="child3" class="block right">a block to align right and with text aligned left</div> </div> كود css المتحكم في العناصر السابقة و الأب parent أيضا: #parent { text-align:center; background-color:blue; height:400px; width:600px; } .block { height:100px; width:200px; text-align:left; } .center { margin:auto; background-color:green; } .left { margin:auto auto auto 0; background-color:red; } .right { margin:auto 0 auto auto; background-color:yellow; } صورة للنتيجة: مثال تطبيقي
- 2 اجابة
-
- 1
-

-
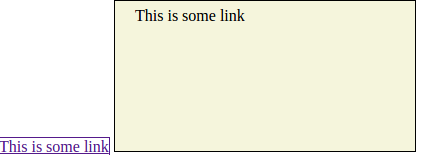
من خلال الموقع الرسمي لـ W3C : *|ns : جميع العناصر ذات namespace ns. *|* : جميع العناصر. *| : جميع العناصر التي لا تندرج ضمن أي namespace. * : إذا لم يتم تحديد أي namespace فإنها تكافئ *|*. إذن فإن * وَ *|* غير متشابهتين ولكل منهما استعمالاتها وإن تشابهتا في جزئية بسيطة. مثال تطبيقي: ملف css جُمعت فيه الخاصيتين: @namespace "http://www.w3.org/2000/svg"; * { background: beige; } *|* { border: 1px solid; } ملف html: <a href="#">This is some link</a> <svg xmlns="http://www.w3.org/2000/svg"> <a xlink:href="#"> <text x="20" y="20">This is some link</text> </a> </svg> النتيجة المحصل عليها:
-
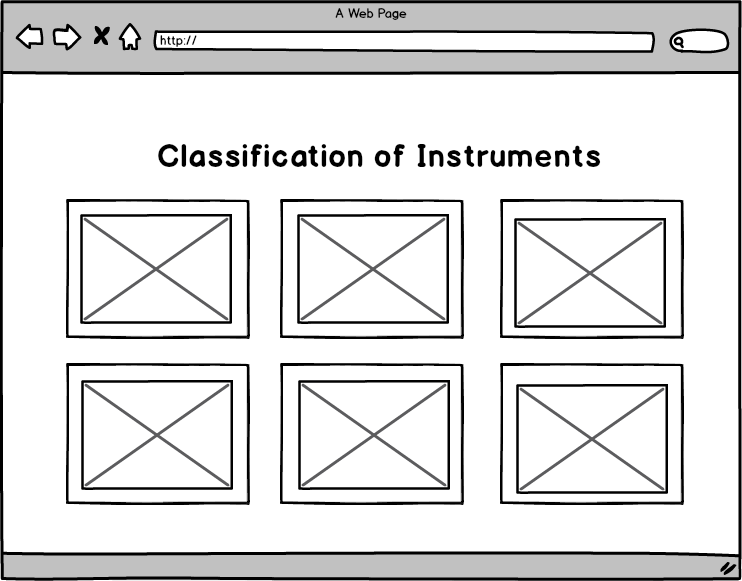
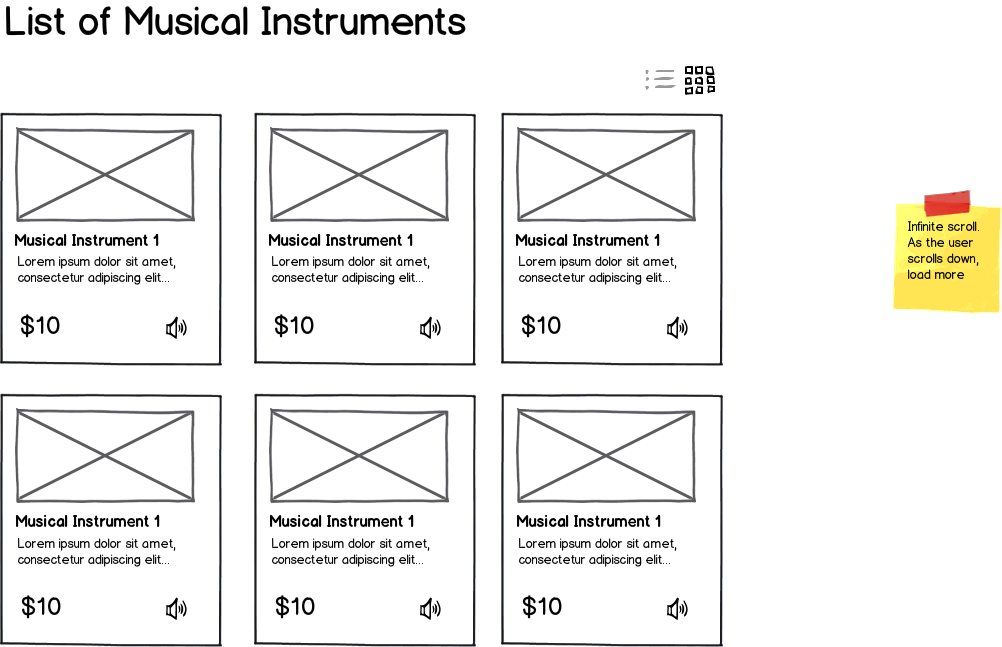
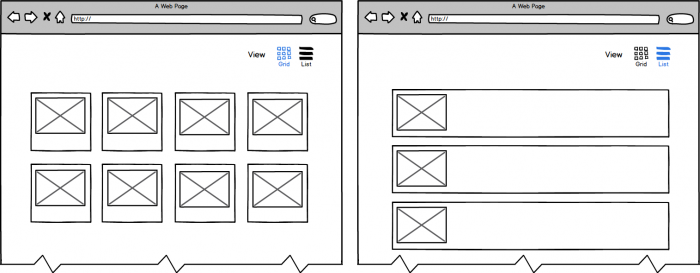
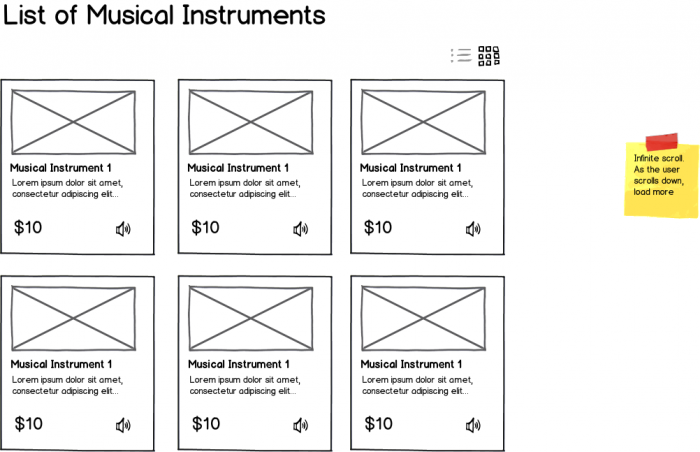
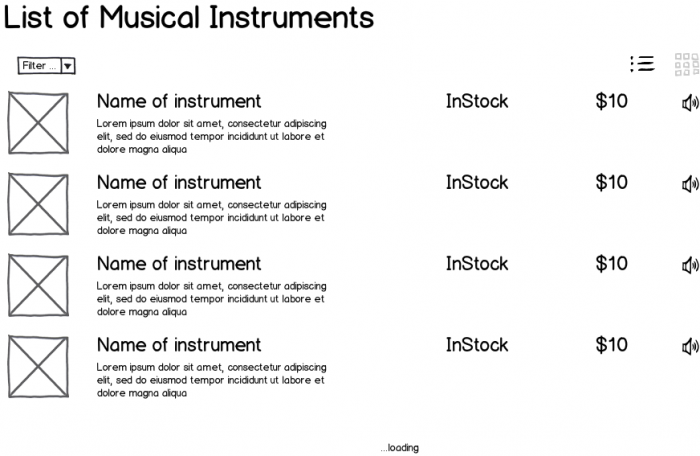
من الجيد طرح هذا السؤال، وعادة ما يقع المصمم في مثل هذه المواقف التي يحتاج فيها إلى أخذ النصيحة من ذوي الخبرة، نصيحتي لك: أدرج الشكلين معاً واترك حرية الاختيار للمستخدم، وذلك بتضمين قائمة صغيرة يختار من خلالها طريقة العرض التي تروقه . على أن تكون صفحة مستقلة تعرض كل الأدوات حسب التصنيفات، حتى يتمكن المُستخدم من الوصول إلى مبتغاه بسرعة: وهذا عرض للمنتجات بشكل يتضمن بعض الوصف (grid): ثم List:

-
عادة ما توفر الجهات المسؤولة عن الامتحانات بوابة إلكترونية مخصصة لتساؤلات العملاء، حيث يمكنك طرح أي استفسار وهم بدورهم سيتكفلون بمهمة الإجابة عنك. بالنسبة لشهادة MCP يمكنك الدخول على الرابط التالي: Microsoft training and certification help، حيث توفر Microsoft خدمة للمساعدة، ويمكنك طرح السؤال هناك. يمكنك أيضا مراسلة موقع البريد الإلكتروني من أجل استعادة كلمة السر وتفعيل أخرى جديدة، عن طريق السؤال السري أو رقم هاتفك -في حال كنت قد سجلته-.
-
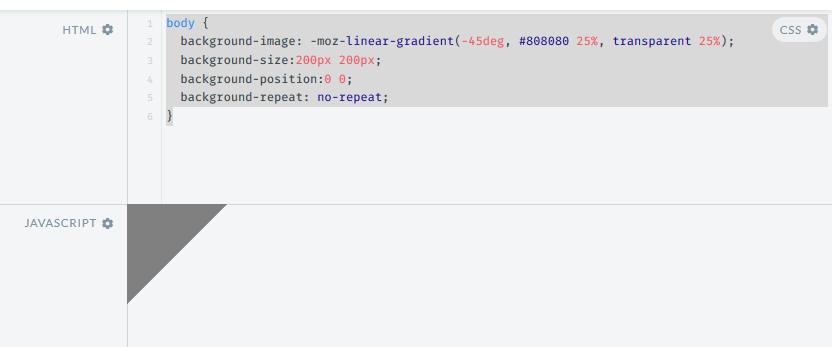
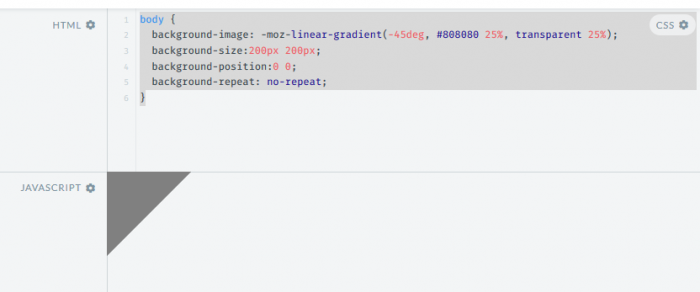
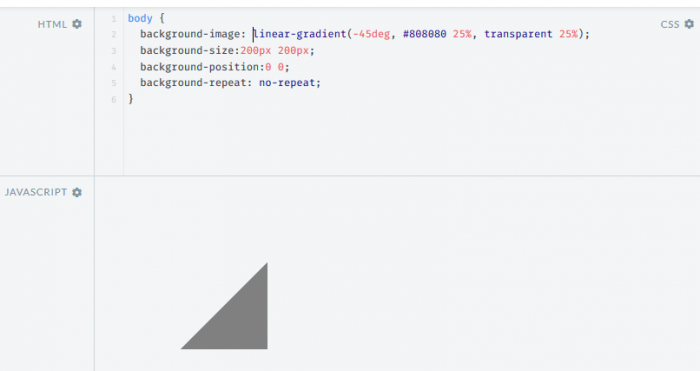
فقط عليك تغيير background-position، بإعطاء هذه الخاصية عدة قيم بوحدة البكسل، بهذا الشكل: body { background-image: linear-gradient(45deg, #808080 25%, transparent 25%), linear-gradient(-45deg, #808080 25%, transparent 25%), linear-gradient(45deg, transparent 75%, #808080 75%), linear-gradient(-45deg, transparent 75%, #808080 75%); background-size: 20px 20px; background-position: 0 0, 0 10px, 10px -10px, -10px 0px; } لتكون نتيجة الكود السابق بعد التعديل: المشكلة المصادف مع استعمال moz- هي في قيمة درجة الزاوية المستعملة 45deg- في linear gradient. وهذا توضيح لذلك: استعمال moz-linear-gradient-: استعمال linear gradient:

-
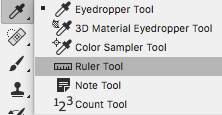
على برنامج Photoshop يمكن إدراج الزاوية الفاصلة بين خطين مصممين بأداة Pen Tool، وذلك باتباع الخطوات التالية: ارسم الخط الأول أفقي أو عمودي. قم بتحديد الخط من خلال لوحة العمل أو من خلال لوحة الطبقات. من خلال الاختصار Ctrl+T والذي يتيح التحكم الحر في الشكل، غيّر من وضعية الرسم السابق إلى وضيعة التحريك. سيظهر لك في أعلى البرنامج حقل لإدراج قيمة الزاوية المراد إدارة الخط بها. أدخل القيمة.
-
أظنك تعلم تمام العلم أن سعر العمل الحر للساعة الواحدة يختلف من تقنية لأخرى ومن مهارة لأخرى ، ذلك أن المحترف ليس وكالمبتدئ، والمبرمج ليس هو المصمم ، الكاتب أو مُدخل البيانات.... لكن على العموم سأعطيك مجال لسعر كل لغة برمجة -بشكل عام- وقد تجد بعض الاستثناء في منطقة أو أخرى حسب القدرة الاقتصادية للبلد، لكن على العموم: PHP - $12 - $18 Ruby on Rails - $20 - $30 Java - $20 - $30 PSD to HTML & Javascript - $13 - $18. *ملاحظة : السعر فوق هو للساعة الواحدة.
-
لا تضيّع وقتك في قراءة الكتب ذات العناوين الجذابة "مثل كيف تجني ثروة من المال في أسبوع"...ضع حدًا لذلك وأنزل إلى الواقع: قم بتصميم موقع شخصي لك تضع فيه معرض الأعمال الخاص بك، وضع داخله عناوين الاتصال بك. قم بالبحث عبر دليل الهاتف عن الشركات والمؤسسات التي من المحتمل أن تطلب عمل، واتصل بهم في أقرب وقت. خصص وقتا للملتقيات والمعارض عبر البحث في دليل مدينتك، واحضرها. احرص على جانب العلاقات الاجتماعية، وقوِّ هذا الجانب لأنه عامل مهم في مجال التسويق لعملك. أنصحك أيضا بعمل نماذج مبسطة لما تبرمجه، وذلك لعرضها على العملاء أثناء اللقاءات. في السنوات الأخيرة انتشر نوع من المواقع التي يعرض عليها كثير من الأشخاص القيام بعمل بمقابل مادي، والتي يتم الاختيار فيها حسب المدينة، من الجيد البحث عنها وعرض مهاراتك هناك. حاول إنتاج منتوجات تحُل مشاكل يعاني منها العملاء في البرامج المثيلة لمنتوجك. استغل شبكات التواصل الاجتماعي في هذا الجانب. لا تيأس وداوم على تطوير مهاراتك.
- 1 جواب
-
- 2
-
-
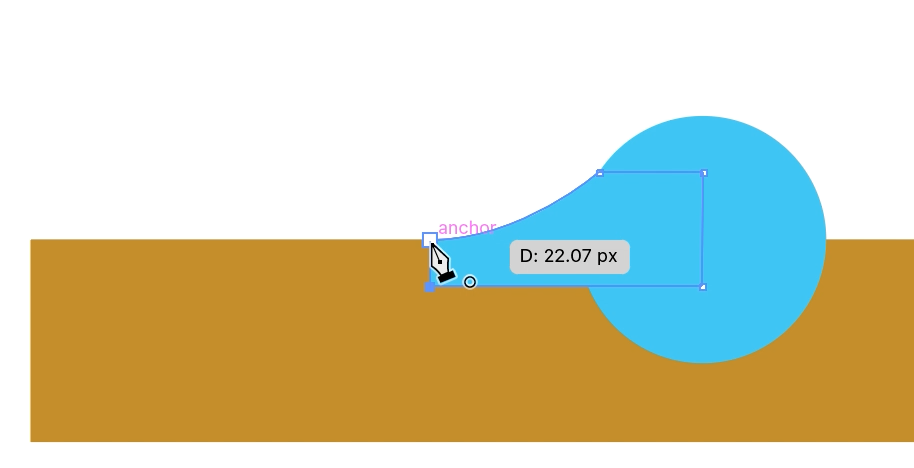
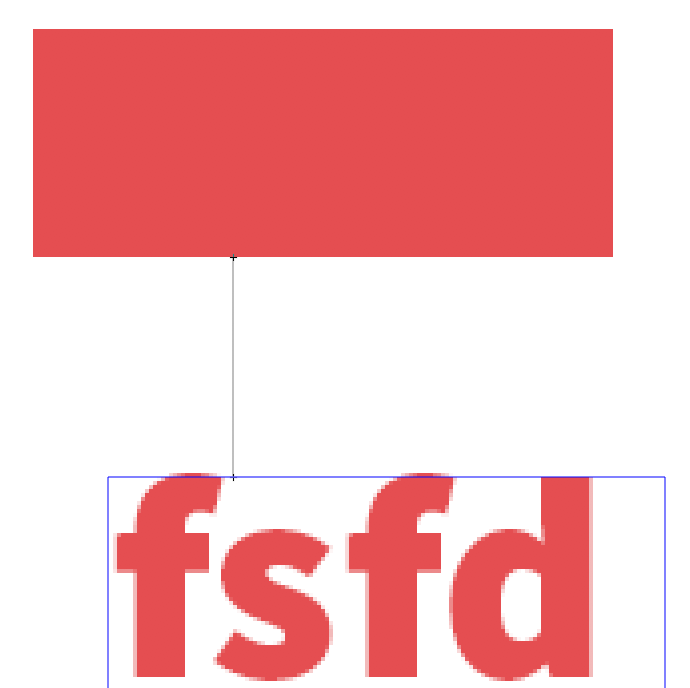
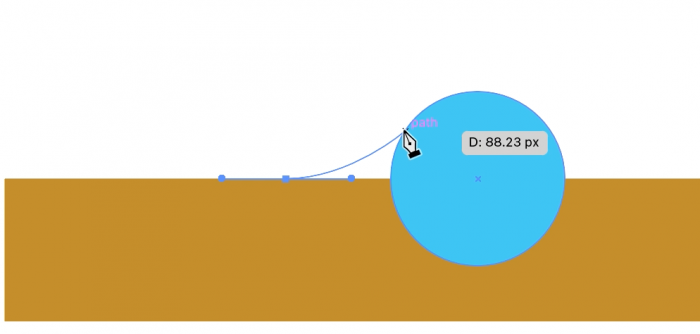
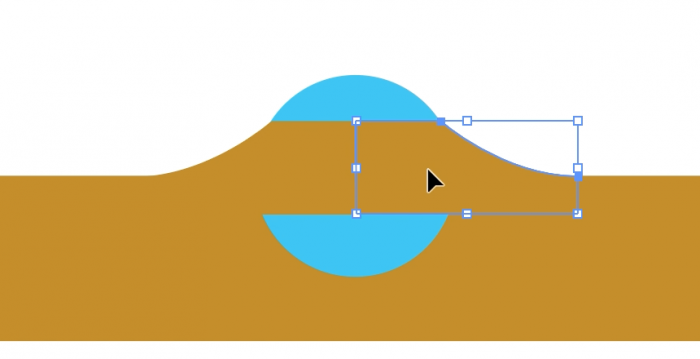
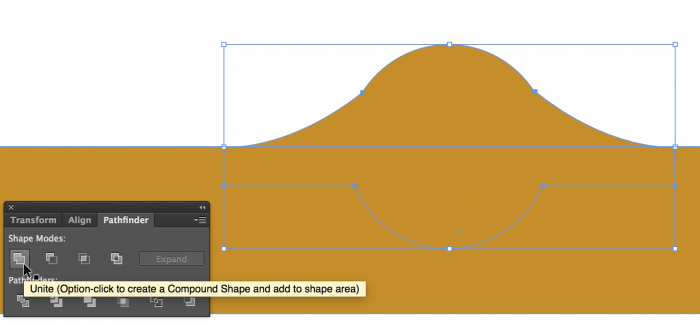
أولا عليك بإنشاء شكل بأداة القلم Pen Tool. ثم اضغط بأداة القلم فوق شكل الكرة، لتنزل أفقيا على الشكل الأساسي (المستطيل): إنهاء الشكل ليأتي ترتيبيا فوق الكرة: انسخ الشكل المنشأ سابقا وأزحه جهة اليمين -مع تغيير اللون ليصبح بنفس لون المستطيل- : ندمج كل الأشكال، باستعمالPathfinder: بهذه الطريقة نكون قد تمكنا من صنع تدرج للكرة تندمج داخل الشكل المستطيل.

-
()url هي بالأساس وظيفة مساعدة 'helper function'، تعيد الرابط على شكل قيمة نصية String، حيث أنها Instance من Illuminate\Routing\UrlGenerator. يمكنك التأكد من طريقة عملها من خلال الملف التالي: src/Illuminate/Foundation/helpers.php على Larave5.2 وَ 5.1 ()url عادة ما تُعيد قيمة نصية، بهذه الطريقة: function url($path = null, $parameters = [], $secure = null) { return app(UrlGenerator::class)->to($path, $parameters, $secure); } الآن في حال كان Parameter يحمل القيمة Null: function url($path = null, $parameters = [], $secure = null) { if (is_null($path)) { return app(UrlGenerator::class); } return app(UrlGenerator::class)->to($path, $parameters, $secure); }
-
على Message Model وبالضبط في وظيفة ()tags التي تزود messages_tags بالبيانات، يجب أن يتوفر على 'messages_id' و 'tags_id'، وللولوج إلى messages يجب استعمال: $tag->messages; لاستعمال Many، جرب هذه الطريقة: $tag = App\tags::with('messages')->where('name','public')->first(); أي استعمل: $tag->messages;
-
تخصيص مدة للدراسة يوميا أظنها بالفكرة السديدة، مما سيجعلك ترتبط بالمادة الممتحن فيها بشكل أفضل. بالنسبة لسؤالك عن المدة والتي اقترحتها أنت بتخصيص ساعة يوميا، هي أيضا جيدة، فقط تبقى المدة التي تفصلك عن الامتحان هي العامل المهم هنا، فإذا كانت تتجاوز الشهرين، ستكون الساعة باليوم جد كافية، في حين كانت خلاف ذلك -شهر واحد أو أقل- ، أعتقد أنه من الجيد رفع المدة قليلا حتى تحيط بجميع محتويات المادة وتدرسها بشكل جيد. حاول أن تضع في الحسبان هذه الأمور عند تحديدك للمدة اللازمة لدراستك بشكل يومي: معرفتك المُسبقة بالمادة، هل أنا مبتدئ أم في مستوى متوسط؟ قدرتك وسرعة استيعابك للدروس. هل بإمكانك الدراسة لأكثر من ساعة يوميا؟ من الجيد أن تستغل الساعات الأولى من كل يوم، يكون عندها العقل أكثر قابلية للاستيعاب.
-
SQL يمكّنك من عمل اسم مستعار Alias لجمل الاستعلام من نوع select، و هذه الخاصية تمكن من الحصول على نتيجة واحدة لجملتي استعلام مُدمجتين، بهذه الطريقة: لنعتبر أننا نتوفر على بنية الجدول التالي: CREATE table a( a int ); create table b( b int ); INSERT INTO a VALUES(1); INSERT INTO b VALUES(2); عند عمل run لجملة الاستعلام التالي، والتي تتوفر على جملتي استعلام تم دمجهما: SELECT x.a, y.b FROM (SELECT * from a) as x, (SELECT * FROM b) as y نحصل على النتيجة التالية:

-
الطريقة اﻷفضل للحصول على ذلك، وهي بإدراج: .menu li { position:relative;...} لتتموضع sub menu بدلالة العنصر الأب المحتوي لها، والذي سيحتوي على القيمة absolute للخاصية relative. ثم سنخصص display: none لـ menu li ul . لنحصل على التنسيق التالي: /* apply to both */ .menu ul { padding-left: 0px; } .menu li { list-style-type: none; display: inline-block; position: relative; padding-left: 0px; margin: 1px; background: #ddd; } .menu li ul { display: none; } .menu li:hover > ul { display: block; position: absolute; background: #000; right: 0; } .menu li:hover > ul li { background: #bbb; white-space: nowrap; }
-
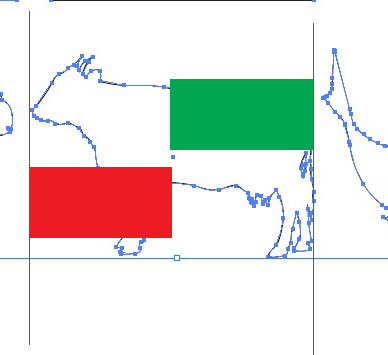
النقطة المركزية للشكل دائما ما تكون في مركزه، فهي رهينة بطول وعرض الشكل، حيث نجدها ممركزة وسط الأشكال الاعتيادية مثل المستطيل، الدائرة... لكنها في الأشكال الهندسية المركبة نوعا ما نجدها غير متمركزة في الوسط بشكل دقيق، وحتى بعض الأشكال والرسوم كرسم البقرة والسمكة مثلا نجد أن النقطة المركزية للشكل نوعاً ما تتمركز في وسط الرسم، رغم أن هذه الأشكال لا تتوفر على خط يمكن أن يشكل محور تماثل لها. ولتوضيح الفكرة أكثر نرفق الصور التالية: إذن فالنقطة المركزية رهينة بتوزيع الشكل على مختلف الرسمة و لا يمكن تغييره.
-
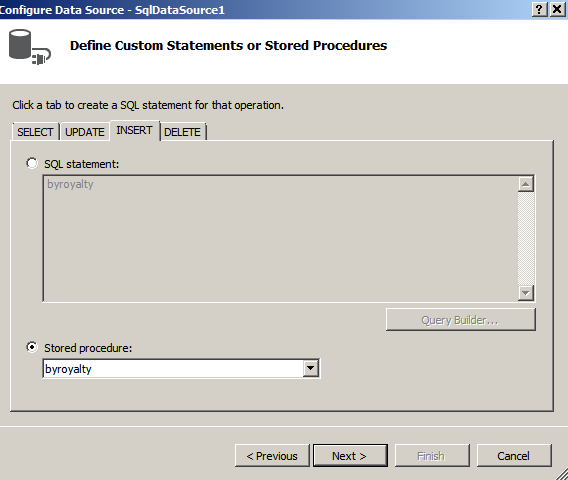
يمكنك التعديل على SqlDataSource المستعملة في تطبيقك، عبر تغيير جملة الاستعلام المستعملة، وذلك من خلال: وهذا نموذج بسيط على الكود المولد بشكل تلقائي، يمكنك التعديل عليه حسب الحاجة: <asp:SqlDataSource ID="SqlDataSource1" runat="server" ConnectionString="<%$ ConnectionStrings:pubsConnectionString %>" SelectCommand="SELECT [ID], [CustomerName], [Population] FROM [TestTable]" InsertCommand="byroyalty" InsertCommandType="StoredProcedure"> <InsertParameters> <asp:Parameter Name="percentage" Type="Int32" /> </InsertParameters> </asp:SqlDataSource>
-
لإظهار نتيجة البيانات المُرسلة من قبل Json على صفحة Jsp، عليك بكتابة الكود التالي: response.setContentType("application/json"); response.setHeader("cache-control", "no-cache"); PrintWriter out = response.getWriter(); out.println(jsonResponse.toString()); out.flush(); ملاحظة مهمة: في غالب الأحيان يقوم المتصفح بالاحتفاظ بالبيانات السابقة عبر مايسمى بـ cache لذا من الجيد إفراغ هذا الأخير عند كل تغيير في كود Json المُرسل. وللتأكد من وصول البيانات المُرسلة، يمكنك استعمال هذا الكود من أجل ذلك: $.post(strUrl, {jsonData: JSON.stringify(formData)}, function(response){ if(response.status=='NOT OK') { alert("not ok"); } else { alert('OK'); } }, 'json');
-
من الجيد أنك طرحت هذا السؤال، وذلك أن العديد من الدارسين يجدون صعوبة في التأقلم مع المادة الممتحن فيها، بالإضافة إلى إيجاد طريقة ناجعة تمكنهم من ضبط المحتوى والتمكن منه، فيما يلي أسرد لك بعض النصائح التي استفدت منها شخصيا أثناء عملية الاستعداد والمذاكرة: حاول أن تجد لنفسك مكاناً غير المنزل للمذاكرة، ذلك أن جو المنزل في الغالب لا يساعد على الدراسة، أو خصص غرفة بها مكتب لهذا الغرض. من الجيد أن تجد بعض الرفقة، أصدقاء هم أيضا يستعدون لهذه الشهادات، وذلك حتى تخلق عامل التحدي والمنافسة بينكم. خصص عددا من الساعات كل يوم من أجل الدراسة، تخللها فترات راحة. كافئ نفسك بعد كل مدة بخرجة مع الأصدقاء أو عائلتك. ضع لنفسك برنامجا يوميا، تسير عليه أثناء ذلك، مع قائمة مهام لتقييم مدى سيرك على الطريق الصحيح. عندما تفتُر عزيمتك، اشحذها بقراءة سير الناجحين والصعوبات التي واجهتم، لأنه ليس هناك جائزة بدون عمل وجهد. تركت النصيحة الأهم للآخر كي تفكّر بها؛ تأمل في دافعك لأخذ الشهادات؟ هل لتحسين وضعك المادي؟ أم لإيجاد عمل؟ أم لمجرد أن يُقال عنك أنك تحمل شهادة بمجال كذا؟ إذا كان هذا الأخير فأنصحك بملء وقتك بأشياء أكثر فائدة
- 2 اجابة
-
- 1
-
-
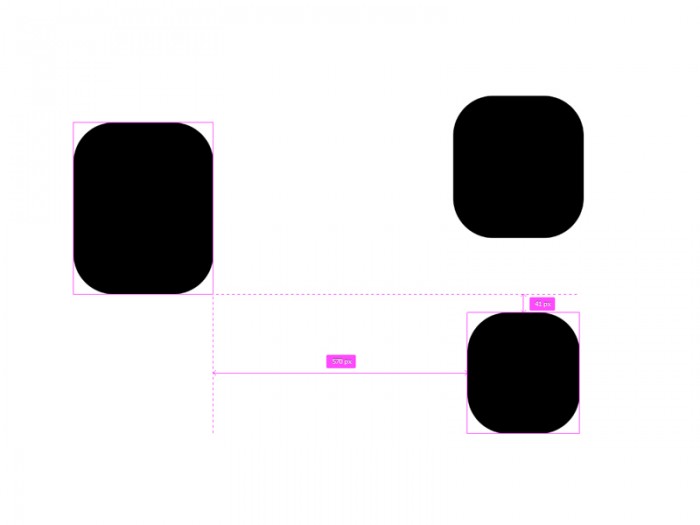
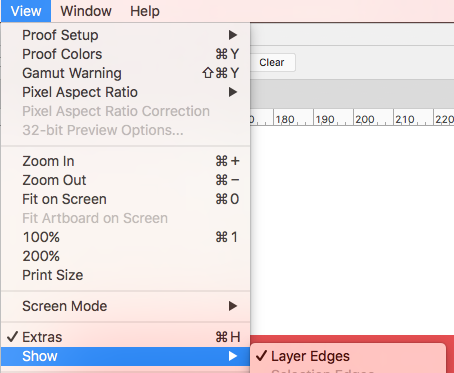
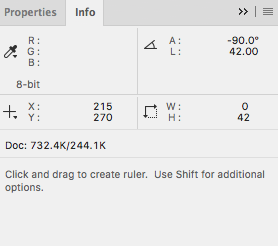
أولا عليك إظهار المسطرة Ruler التي توجد في جنبات المشروع، وذلك من خلال القائمة: ثم من خلال الاختصار I أو من القائمة الجانبية للأدوات: لنتمكن بعد ذلك من قياس المسافة الفاصلة بين الأشكال: لتظهر المقاسات أسفل البرنامج: أو عند تحريكك لشكل معين، حيث تظهر المقاسات بجانبه، هكذا:

-
حاول تجربة هذا النموذج من الكود. كودhtml : <p> <label for="dateRange">Choose timeframe</label> </p> <div id="dateRange" class="btn default"> <i class="fa fa-calendar"></i> <span> </span> <b class="fa fa-angle-down"></b> </div> كود Java Script المسؤول عن إظهار calendar: var startDate = moment().subtract('month', 1).startOf('month'), endDate = moment().subtract('month', 1).endOf('month'); $('#dateRange').daterangepicker({ opens: (App.isRTL() ? 'left' : 'right'), startDate: startDate, endDate: endDate, dateLimit: { years: 1 }, showDropdowns: true, showWeekNumbers: true, timePicker: false, ranges: { 'Today': [moment(), moment()], 'Yesterday': [moment().subtract('days', 1), moment().subtract('days', 1)], 'Last 7 Days': [moment().subtract('days', 6), moment()], 'Last 30 Days': [moment().subtract('days', 29), moment()], 'Last Month': [moment().subtract('month', 1).startOf('month'), moment().subtract('month', 1).endOf('month')] }, autoApply: true, format: 'MM/DD/YYYY', separator: ' to ', locale: { applyLabel: 'Apply', fromLabel: 'From', toLabel: 'To', customRangeLabel: 'Custom Range', daysOfWeek: ['Su', 'Mo', 'Tu', 'We', 'Th', 'Fr', 'Sa'], monthNames: ['January', 'February', 'March', 'April', 'May', 'June', 'July', 'August', 'September', 'October', 'November', 'December'], firstDay: 1 } }, function (start, end) { // updating the span with current dates $('#dateRange span').html(start.format('MMMM D, YYYY') + ' - ' + end.format('MMMM D, YYYY')); // Saving the new dates in your startDate and endDate variables. startDate = start; endDate = end; } ); //Set the initial state of the picker label $('#dateRange span').html(startDate.format('MMMM D, YYYY') + ' - ' + endDate.format('MMMM D, YYYY')); ليظهر الحقل بالشكل التالي: هذا الموقع الذي يقدم إضافة JavaScript خاصة بشهرية-Calendar- جذابة

-
قم بإنشاء كائن منForm1 بالطريقة التالية: formRRAS main = new formRRAS(); كما يتوجب عليك تمرير formRRAS عند مناداة AddRFR، هكذا: public partial class NewRFRPopup : Form { formRRAS _main; public NewRFRPopup(formRRAS main) { InitializeComponent(); _main = main; } ثم داخل handler: string newRFR = txtNewRFR.Text; _main.AddRFR(newRFR); this.Close(); ثم عند إنشاء formRRS: NewRFRPopup popup = new NewRFRPopup (this); popup.ShowDialog();
-
لا أنصحك باتخاذ هذا الأمر كعادة، لأنها بالتأكيد عادة سيئة، وتوحي بأن الممتحن متكاسل نوعاً ما، فليس بالضرورة أن تفشلَ في امتحانك الأول لتنجح في المرة الثانية، وإليك بعض السلبيات من جراء هذا السلوك: إضاعة الوقت: أعتقد -بل أجزم- أن الوقت هو العامل الأكثر قيمة في حياة المرء، وربما لم تدرك بعد قيمته، فالوقت الذي ستضيعه في إعادة الامتحان خصصه لدراسة شهادة أخرى وذلك طبعاً بعد نجاحك في أول مرة. عادة سيئة: من شأن هذه العادة أن تؤثر على جميع سلوكياتك في الحياة، وبطريقة أو أخرى ستتجنب دائما النجاح منذ الوهلة الأولى رغم قدرتك على ذلك. فقدان شرف نيل الشهادة من الامتحان الأول: غالبا ما يتنافس المُمتحَنون حول إمكانية الحصول على الشهادة عند امتحانهم الأول، وليس الثاني أو الثالث، وهذا يبرز مدى تمكنهم من المادة ودرجة استعدادهم للامتحان، وأيضا غرض استغلالهم للوقت والمصاريف. ركز أثناء الاستعداد والمذاكرة، ولا تشغل نفسك بمثل هذه الاستراتيجيات -غير النافعة- التي ستضاعف مجهودك من أجل تحقيق أهدافك، في حين بإمكانك سلك أقصر وأنجع الطُرق. حاول أن تركز بشكل جيد على نُسخ الامتحانات السابقة من نفس الشهادة، واجعلها بمثابة تجارب قبل الامتحان الحقيقي، الذي ستنال من خلاله الشهادة.