
E.Nourddine
-
المساهمات
1458 -
تاريخ الانضمام
-
تاريخ آخر زيارة
-
عدد الأيام التي تصدر بها
18
نوع المحتوى
ريادة الأعمال
البرمجة
التصميم
DevOps
التسويق والمبيعات
العمل الحر
البرامج والتطبيقات
آخر التحديثات
قصص نجاح
أسئلة وأجوبة
كتب
دورات
كل منشورات العضو E.Nourddine
-
اقترح عليك الإطلاع على هذا المقال حيث يتطرق فيه الكاتب إلى كيفية استعمال Elastic IP مع EC2. وأيضا لربط Amazon EC2 بخادم SFTP، إليك رابط لهذالمقال. مصدر 1. مصدر2.
-
الكود المقترح: include <iostream> #include <string> using namespace std; int main() { // تعريف المتغيرات int fund[4], con,clas=0,mc=0,i; string classtr[] ={"freshmen","sophomores", "juniors", "seniors"}; // حلقة تكرار while إلى غاية إدخال القيمة 999 while(clas!=999) { //قراءة مدخلات المستخدم cout<<"1.freshmen \n 2.sophomores \n 3.juniors \n 4.seniors"<<endl; cout<<"Enter your class:"; cin>>clas; if(clas!=999) { cout<<"Enter your contribution amount$:"<<endl; cin>>con; // حساب وجمع جيمع القيم المدخلة حسب الصنف each class if(clas==1) { fund[0]=fund[0]+con; con=0; } else if(clas==2) { fund[1]=fund[1]+con; con=0; } else if(clas==3) { fund[2]=fund[2]+con; con=0; } else if(clas==4) { fund[3]=fund[3]+con; con=0; } } } // حساب أكبر مبلغ class int max=fund[0]; for(i=1;i<4;i++) { if(max<fund[i]) { max=fund[i]; mc=i; } } // طباعة مجموع المبالغ المدخلة وحسب الصنف 1-2-3 أو 4 class cout<<"The class and the collected fund:"<<endl; for(i=0;i<4;i++) { cout<<classtr[i]<<" collects $"<<fund[i]<<endl; } cout<<"The maximum fund collected class is " <<classtr[mc]<<" and collected fund is$ "<<fund[mc]<<endl; return 0; }
-
انطلاقا من نص السؤال باللغة الانجليزية، يتضح أن الغرض منه هو إنشاء كلاس تقوم هذا العمل، حيث يدخل المستخدم قيمة التبرع و الصنف، ليتم تخزين القيم إلى حين إدراج القيمة 999 لتنتهي العملية آنذاك، وتظهر النتيجة النهائية لأكبر مبلغ مدرج وفي أي صنف : مرفق مع وملف نصي به الكود المقترح، أتمنى أن تكون الاستفادة وتأخذي فكرة عما يجدر بك فعله المراحل تعريف المتغيرات إنشاء حلقة تكرار إلى غاية إدخال 999 قراءة مدخلات المستخدم حساب وجمع جميع القيم المدخلة حسب الصنف حساب أكبر مبلغ طباعة مجموع المبالغ المدخلة وحسب الصنف 1-2-3 أو 4 codeملف
-
لتغيير مصدر الصورة داخل PictureBox استعمل: Private Sub Button1_Click(sender As Object, e As EventArgs) Handles Button1.Click PictureBox1.Image = Image.FromFile("C:\1.jpg") End Sub Private Sub Button2_Click(sender As Object, e As EventArgs) Handles Button2.Click PictureBox1.Image = Image.FromFile("C:\2.jpg") End Sub ولتغيير موضع PictureBox : PictureBox1.Location = sender.Location ثم غير إحداثياتX وَY،بهذه الطريقة : 'Changing X axis PictureBox1.Left = sender.Left 'Changing Y axis PictureBox1.Top = sender.Top
-
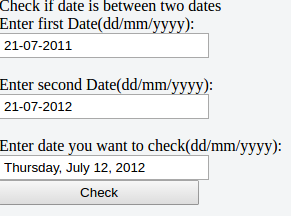
كودjquery هذا يقوم بالتأكد من أن التاريخ المُدخل يقع بين قيمتي تاريخ، وبالتالي يمكن التحكم فيه، السكريت كما يلي: function dateCheck() { var fDate,lDate,cDate; fDate = $.datepicker.parseDate('dd-mm-yy', $('#fDate').val()); lDate = $.datepicker.parseDate('dd-mm-yy', $('#lDate').val()); cDate = $.datepicker.parseDate("DD, MM d, yy", $('#cDate').val()); if((cDate <= lDate && cDate >= fDate)) { alert("true"); return true; } alert("false"); return false; } كود html للحقول: <h2>Check if date is between two dates</h2> Enter first Date(dd/mm/yyyy): <input type="text" name="fDate" id="fDate" value='21-07-2011'/><br/> Enter second Date(dd/mm/yyyy): <input type="text" name="lDate" id="lDate" value='21-07-2012'/><br/> Enter date you want to check(dd/mm/yyyy): <input type="text" name="cDate" id="cDate" value='Thursday, July 12, 2012'/> <input type="submit" value="Check" onclick="dateCheck();" /> النتيجة:
-
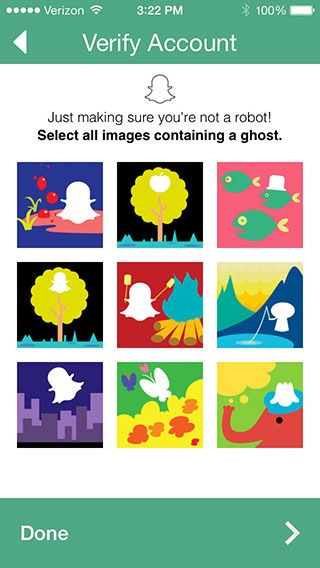
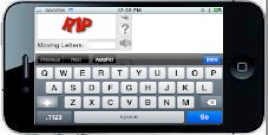
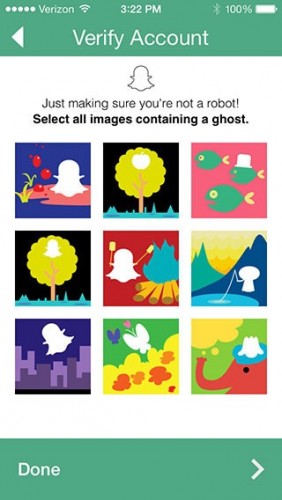
يلجأ البعض إلى استعمال "The slider CAPTCHA": أو عن طريق اختيار الصور التي تحتوي موضوع مشترك: MotionCAPTCHA: أو إدخال كودcapatch:


-
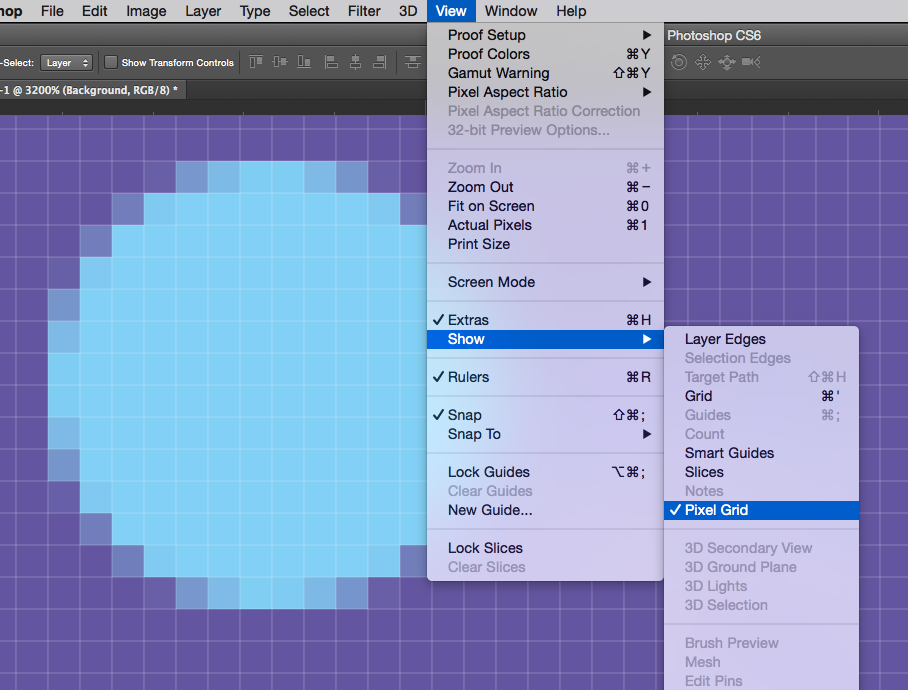
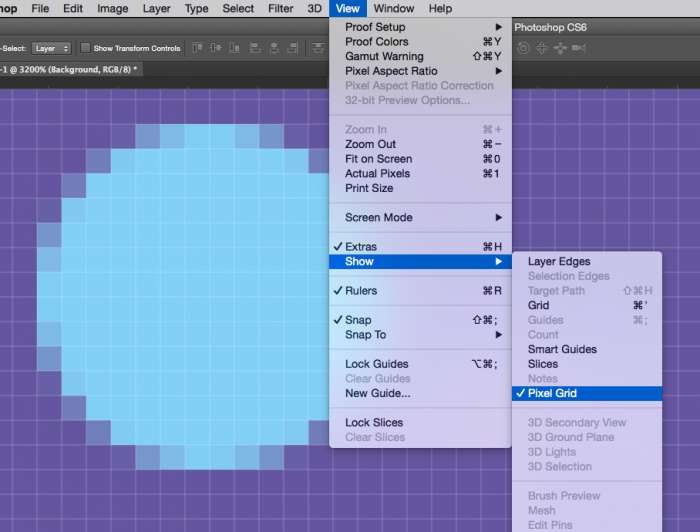
يمكن إخفاء الشبكة من القائمة التالية : View -> Show -> Pixel Grid
-
داخل model عليك بإضافة العلاقة has_many والتي تربط جدول article بجدول comments: Class Article < ActiveRecord::Base has_many :comments, -> { order 'created_at' } do def recent limit(4) end end end لتتمكن من استعمال articles بالطريقة التالية: @articles.each do |article| article.comments.recent.each do |comment| stuff end end هذا مثال آخر، يتعلق بصورة'Picture'والتعليقات'comments' الخاصة بها: Class Picture < ActiveRecord::Base has_many :comments, :order => 'id DESC' do def recent limit(10) end end end
-
أظن أن الأمر مشروح بطريقة وافية من خلال رابط الموقع الرسمي حيث أن: حلقة التكرار for تسمح للعداد i بالاحتفاظ بالقيمة الأخير عند الخروج من الحلقة، مثال على ذلك: for i in 1..3 end i #=> 3 بينما الأمر خلاف ذلك عند استعمال حلقة التكرار foreach، التي تنتهي المتغيرات والعداد المُستخدم داخلها بعد انتهائها: (1..3).each do |i| end i #=> NameError: undefined local variable or method `i'
-
الطريقة السهلة لعمل ذلك -معرفة نوع المتصفح المُستعمل-، وهو باستخدام WebDriver الذي يمكن استعماله بالطريقة التالية: def setup client = Selenium::WebDriver::Remote::Http::Default.new client.timeout = 120 case $browserName when "firefox" $browser = Selenium::WebDriver.for(:firefox, :http_client => client) when "chrome" $browser = Selenium::WebDriver.for(:chrome, :http_client => client) when "safari" $browser = Selenium::WebDriver.for(:safari, :http_client => client) when "IE" $browser = Selenium::WebDriver.for(:internet_explorer, :http_client => client) else puts "ERROR: Wrong browser name!!" end $browser.get "" $wait = Selenium::WebDriver::Wait.new(:timeout => 30) end حيث يمكن معرفة اسم المتصفح في الجزء: browser_name = $browser.browser.to_s وللتأكد من متصفح معين 'firefox مثلا': if browser_name == "firefox" #تنفيذ الأوامر البرمجية هنا end
-
يمكنك استعمال خط واحد بدل الخطين، ليسهل عليك الحصول على النتيجة المرغوب فيها، وذلك بالكود التالي: \documentclass{article} \usepackage{tikz} \begin{document} \begin{tikzpicture}[line join=round, x=1pt, y=1pt, thick] \draw (0,0) -- (30,0); \draw[yscale=2] foreach \x in {2,...,9}{ (\x*15,0) -- (\x*15,50) -- (\x*15+7.5,50) -- (\x*15+7.5,-50) -- (\x*15+15,-50) -- (\x*15+15, 0) } -- (200,0); \end{tikzpicture} \end{document} لتحصل على :

-
كما تعلم تتوفر تقنية css3على إمكانية تغيير الصور عند حدث معين مثلا hover، حيث يوضع داخل كود التنسيق عند هذا الحدث رابط الصورة الجديدة والتي تظهر بمجرد مرور زر الفأرة فوق الرابط أو العنصر المعني بالحدث. كما يمكن تغيير موضع الصورة، حيث أن الصورة المستعملة كخلفية تتكون من صور عدة، وفي كل حدث يتغير موضع الصورة البارز. مثال: باعتبار الصور التالية: وهذا الكود المسؤول عن تغيير موضع position الصورة في الخلفية: .flags-canada, .flags-mexico, .flags-usa { background-image: url('../images/flags.png'); background-repeat: no-repeat; } .flags-canada { height: 128px; background-position: -5px -5px; } .flags-usa { height: 135px; background-position: -5px -143px; } .flags-mexico { height: 147px; background-position: -5px -288px; }

-
المشكل أنه في جمل الاستعلام من هذا النوع يجب استعمال 'parametrized queries' والتي تمكنك من استعمال القيم عن طريق علامات ومتغيرات تبدأ بعلامة@، مثلا 'Telephone@' على أن يتم إعطاء قيمة لهذه العلامة فيما بعد. حيث أقترح عليك لاستعمال هذا السكريبت عوض السابق:' // تعريف جملة الاستعلام string connectionStirng = "....."; string insertQry = "INSERT INTO tem (Telephone, Status, CreateDate) VALUES (@Telephone, @Status, @CreateDate);"; using (SqlConnection conn = new SqlConnection(connectionString)) using (SqlCommand cmd = new SqlCommand(insertQry, conn)) { // parameters العلامات cmd.Parameters.Add("@Telephone", SqlDbType.VarChar, 50).Value = telephone; cmd.Parameters.Add("@Status", SqlDbType.VarChar, 20).Value = status; cmd.Parameters.Add("@CreateDate", SqlDbType.DateTime).Value = DateTime.Now; // ، وتنفيذ حملة الاستعلام connection فتح conn.Open(); int rowsInserted = cmd.ExecuteNonQuery(); conn.Close(); }
-
توفر Microsoft إمكانية الحصول على عنوان IP العميل من خلال tcpClient.Client.LocalEndPoint، ويمكنك التعمق أكثر حول الموضوع من خلال Socket.LocalEndPoint Property . والكود التالي هو بمثابة مثال تطبيقي لكيفية الحصول على IP الخاص بمستخدم التطبيق: var localEndPoint = tcpClient.Client.LocalEndPoint as IPEndPoint; var localAddress = localEndPoint.Address; var localPort = localEndPoint.Port; ويمكنك أيضا استعمال الكود التالي، الذي يؤدي نفس الوظيفة : public static string GetLocalIPAddress() { var host = Dns.GetHostEntry(Dns.GetHostName()); foreach (var ip in host.AddressList) { if (ip.AddressFamily == AddressFamily.InterNetwork) { return ip.ToString(); } } throw new Exception(" غير موجود IP عنوان"); }
-
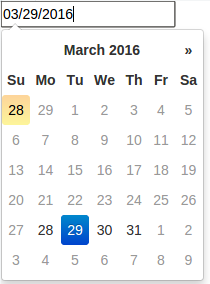
عليك باستعمال setStartDate لتفعيل التاريخ داخل datepiker: $('.datepick').datepicker({ autoclose: true, todayHighlight: true, /* startDate: '+1m' This option will work here*/ }); $('#mydate').datepicker('setStartDate','+1m'); وهذه صفحة html: <link href="http://netdna.bootstrapcdn.com/bootstrap/3.0.0/css/bootstrap.min.css" rel="stylesheet"/> <link href="http://cdnjs.cloudflare.com/ajax/libs/bootstrap-datepicker/1.2.0/css/datepicker.css" rel="stylesheet"/> <script src="https://ajax.googleapis.com/ajax/libs/jquery/1.11.1/jquery.min.js"></script> <script src="http://cdnjs.cloudflare.com/ajax/libs/bootstrap-datepicker/1.2.0/js/bootstrap-datepicker.min.js"></script> <input id="mydate" class="datepick" type="text"> النتيجة: مثال تطبيقي.
-
هذه هي الأوامر المسؤولة عن التراجع عن عمليةcommit : $ git commit -m "Something terribly misguided" (1) $ git reset --soft HEAD~ (2) << edit files as necessary >> (3) $ git add ... (4) $ git commit -c ORIG_HEAD (5) التراجع عن آخر عملية commit -ما تبحث عنه-. عندما تتذكر commit معينة تريد التراجع عنها. التعديل على ملفات الشجرة tree files. إضافة تغييرات جديدة وتحديثات . إرسال commit مع التغييرات الجديدة علىBranch.
-
إذا كنت تريد تغيير اسم أيbranch، ببساطة نفذ الأمر من خلال الطرفية: git branch -m <oldname> <newname> أما إذا كنت تريد تغيير اسمBranch الحالية، ما عليك إلا تنفيذ الأمر التالي: git branch -m <newname> على أي، تذكر أن m- من أجل نقل 'أوmv'،وهي بالتأكيد تتيح تغيير اسم الملفات.
-
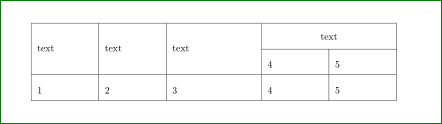
نعم يمكنك فعل ذلك على برنامج تحرير الوثائق LaTeX، وذلك باستخدام الخاصيتين \multirow{} وَ \multicolumn{} حيث تأخذ كقيمة عدد الخانات المُراد مزجها، سواء أكانت لصفوف أم أعمدة، وهذا الكود يعطيك فكرة أوضح حول إمكانية فعل ذلك: \documentclass[a4paper]{report} \usepackage{multirow} \usepackage{array} \begin{document} \begin{table}[h] \centering \renewcommand{\arraystretch}{2} \begin{tabular}{|m{2cm}|m{2cm}|m{3cm}|m{2cm}|m{2cm}|} \hline \multirow{2}*{text} & \multirow{2}*{text} & \multirow{2}*{text} & \multicolumn{2}{c|}{text}\\ \cline{4-5} & & & 4 & 5\\ \hline 1 & 2 & 3 & 4 & 5\\ \hline \end{tabular} \end{table} \end{document} لنحصل في الأخير على جدول بخانات ممزوجة :
-
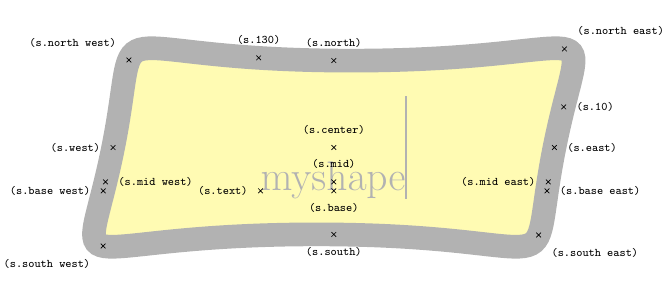
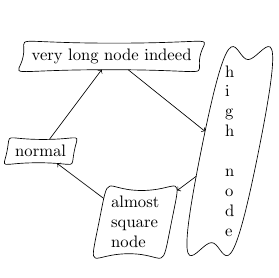
الفكرة المستعملة لإنشاء هذا النوع من الأشكال، هي إنشاء شكل مستطيلي مع تغيير في مكان بعض النقط الموجودة على الإطار الخارجي له. تُعرّف هذه الأشكال بـ macro \myshapepath، حيث تستعمل مكتبة خاصة بتقاطع النقط the intersection library، وهذا الكود مخصص لإنشاء شكل بهذه الطريقة: \documentclass{standalone} \usepackage{tikz} \usetikzlibrary{intersections} \makeatletter \def\myslant{0.2} % defines the skew of the right and left side \def\myxsep{0.5} % extra distance in x direction; relative to node height \def\myvhandlelen{.85} % length of the vertical bezier handles; relative to node height \def\myhhandlelen{.65} % length of the horizontal bezier handles; relative to node width \def\mypoint#1#2#3{ % #1 = x coordinate, in multiples of the width % #2 = y coordinate, in multiples of the height, slanted % #3 = x coordinate, relative to height and slant factor \pgfpointdiff{\southwest}{\northeast} \pgf@xc=\pgf@x % xc = width of the node \pgf@yc=\pgf@y % yc = height of the node \pgf@xb=\myslant\pgf@yc % xb = width of the node scaled by \myslant \southwest \advance\pgf@x by .5\pgf@xc \advance\pgf@y by .5\pgf@yc \advance\pgf@x by #1\pgf@xc \advance\pgf@y by #2\pgf@yc \advance\pgf@x by #2\pgf@xb \advance\pgf@x by #3\pgf@xb } % this defines the shape of the node; the macro is used for drawing the shape as well as for calculating intersection points \def\myshapepath{ \pgfpathmoveto{\mypoint{-.5}{0}{-\myxsep}} \pgfpathcurveto{\mypoint{-.5}{\myvhandlelen}{-\myxsep}}{\mypoint{-\myhhandlelen}{.5}{0}}{\mypoint{0}{.5}{0}} \pgfpathcurveto{\mypoint{\myhhandlelen}{.5}{0}}{\mypoint{.5}{\myvhandlelen}{\myxsep}}{\mypoint{.5}{0}{\myxsep}} \pgfpathcurveto{\mypoint{.5}{-\myvhandlelen}{\myxsep}}{\mypoint{\myhhandlelen}{-.5}{0}}{\mypoint{0}{-.5}{0}} \pgfpathcurveto{\mypoint{-\myhhandlelen}{-.5}{0}}{\mypoint{-.5}{-\myvhandlelen}{-\myxsep}}{\mypoint{-.5}{0}{-\myxsep}} \pgfpathclose } % compute an intersection point between a line and \myshapepath \def\myshapeanchorborder#1#2{ % #1 = point inside the shape % #2 = direction \pgftransformreset % without this, the intersection commands yield strange results \pgf@relevantforpicturesizefalse % don't include drawings in bounding box \pgfintersectionofpaths{ \myshapepath %\pgfgetpath\temppath\pgfusepath{stroke}\pgfsetpath\temppath % draw path for debugging }{ \pgfpathmoveto{ \pgfpointadd{ \pgfpointdiff{\southwest}{\northeast}\pgf@xc=\pgf@x \advance\pgf@xc by \pgf@y % calculate a distance that is guaranteed to be outside the shape \pgfpointscale{ \pgf@xc }{ \pgfpointnormalised{ #2 } } } { #1 } } \pgfpathlineto{#1} %\pgfgetpath\temppath\pgfusepath{stroke}\pgfsetpath\temppath % draw path for debugging } \pgfpointintersectionsolution{1} } \def\myshapeanchorcenter{ \pgfpointscale{.5}{\pgfpointadd{\southwest}{\northeast}} } % we could probably re-use some existing \dimen, but better be careful \newdimen\myshapedimenx \newdimen\myshapedimeny \pgfdeclareshape{myshape}{ % some stuff, we can inherit from the rectangle shape \inheritsavedanchors[from=rectangle] \inheritanchor[from=rectangle]{center} \inheritanchor[from=rectangle]{mid} \inheritanchor[from=rectangle]{base} % calculate these anchors so they lie on a coorinate line with .center \anchor{west}{\myshapeanchorborder{\myshapeanchorcenter}{\pgfpoint{-1cm}{0cm}}} \anchor{east}{\myshapeanchorborder{\myshapeanchorcenter}{\pgfpoint{1cm}{0cm}}} \anchor{north}{\myshapeanchorborder{\myshapeanchorcenter}{\pgfpoint{0cm}{1cm}}} \anchor{south}{\myshapeanchorborder{\myshapeanchorcenter}{\pgfpoint{0cm}{-1cm}}} % calculate these anchors so they lie on a line through .center and the corresponding anchor of the underlying rectangle \anchor{south west}{\myshapeanchorborder{\myshapeanchorcenter}{\pgfpointdiff{\myshapeanchorcenter}{\southwest}}} \anchor{north east}{\myshapeanchorborder{\myshapeanchorcenter}{\pgfpointdiff{\myshapeanchorcenter}{\northeast}}} \anchor{south east}{\myshapeanchorborder{\myshapeanchorcenter}{\pgfpointdiff{\myshapeanchorcenter}{\northeast\pgf@xa=\pgf@x\southwest\pgf@x=\pgf@xa}}} \anchor{north west}{\myshapeanchorborder{\myshapeanchorcenter}{\pgfpointdiff{\myshapeanchorcenter}{\southwest\pgf@xa=\pgf@x\northeast\pgf@x=\pgf@xa}}} % somewhat more special anchors. The coordinate calculations were taken from the rectangle node \anchor{mid west}{\myshapeanchorborder{\myshapeanchorcenter\pgfmathsetlength\pgf@y{.5ex}}{\pgfpoint{-1cm}{0cm}}} \anchor{mid east}{\myshapeanchorborder{\myshapeanchorcenter\pgfmathsetlength\pgf@y{.5ex}}{\pgfpoint{1cm}{0cm}}} \anchor{base west}{\myshapeanchorborder{\myshapeanchorcenter\pgf@y=0pt}{\pgfpoint{-1cm}{0cm}}} \anchor{base east}{\myshapeanchorborder{\myshapeanchorcenter\pgf@y=0pt}{\pgfpoint{1cm}{0cm}}} \backgroundpath{ % uncomment to draw underlying rectangle node %\southwest\pgf@xa=\pgf@x \pgf@ya=\pgf@y %\northeast\pgf@xb=\pgf@x \pgf@yb=\pgf@y %\pgfpointdiff{\southwest}{\northeast}\pgf@xc=\pgf@x \pgf@yc=\pgf@y %\pgfpathmoveto{\pgfpoint{\pgf@xa}{\pgf@ya}} %\pgfpathlineto{\pgfpoint{\pgf@xa}{\pgf@yb}} %\pgfpathlineto{\pgfpoint{\pgf@xb}{\pgf@yb}} %\pgfpathlineto{\pgfpoint{\pgf@xb}{\pgf@ya}} %\pgfpathclose \myshapepath } \anchorborder{ \myshapedimenx=\pgf@x \myshapedimeny=\pgf@y \myshapeanchorborder{\myshapeanchorcenter}{\pgfpoint{\myshapedimenx}{\myshapedimeny}} } } \makeatother \tikzset{shape example/.style={color=black!30,draw,fill=yellow!30,line width=.5cm,inner xsep=2.5cm,inner ysep=0.5cm}} \begin{document} {\Huge\begin{tikzpicture} \node[name=s,shape=myshape,shape example] {myshape\vrule width 1pt height 2cm}; \foreach \anchor/\placement in { north west/above left, north/above, north east/above right, west/left, center/above, east/right, mid west/right, mid/above, mid east/left, base west/left, base/below, base east/right, south west/below left, south/below, south east/below right, text/left, 10/right, 130/above% } { \draw[shift=(s.\anchor)] plot[mark=x] coordinates{(0,0)} node[\placement] {\scriptsize\texttt{(s.\anchor)}}; } \end{tikzpicture}} \begin{tikzpicture} \draw (-2.0, 0.0) node[draw,myshape] (a) {normal}; \draw (-0.5, 2.0) node[draw,myshape] (b) {very long node indeed}; \draw ( 2.0, 0.0) node[draw,myshape,align=left] (c) {h\\i\\g\\h\\\\n\\o\\d\\e}; \draw ( 0.0,-1.5) node[draw,myshape,align=left] (d) {almost\\square\\node}; \draw[->] (a) -> (b); \draw[->] (b) -> (c); \draw[->] (c) -> (d); \draw[->] (d) -> (a); \end{tikzpicture} \end{document} وهذا شكل توضيحي لكيفية الرسم: الميزة المُميزة هنا هي إمكانية التحكم في الشكل ككل رغم أن الأمر قد يبدو صعبا نوعاً ما.
-
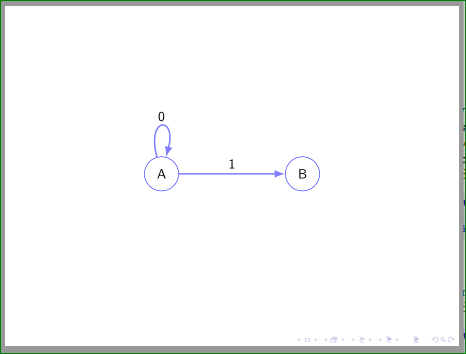
جرب هذا الكود: \documentclass{beamer} \usepackage{tikz} \usetikzlibrary{arrows.meta,automata,quotes,positioning,shapes} \begin{document} \begin{frame} \centering \begin{tikzpicture}[ node distance=3cm, >={Latex[blue!50]}, every state/.style={ellipse,draw=blue}, every edge/.style={draw=blue!50,very thick,->}, every loop/.style={min distance=12mm}, auto ] \node (q1) [state] {A}; \node (q2) [state,right=of q1] {B}; \path (q1) edge ["1"] (q2) (q1) edge [loop above,"0"] (); \end{tikzpicture} \end{frame} \end{document} استعملت مكتبة TikZ لرسم السهمين. يرجع سبب اختلاف رسم السهمين في النتيجة المٌُحصل عليها عند كل منحى، فعند الذهاب من a إلى a سيكون الناتج هو القيمة 0، بينما عند الذهاب من a إلى b هو 1، لذا كان عدم تكرار العقدة a مرتين الحل الأفضل و توجيه السهم نحوها.
-
لقد قمت بتخزينها فعلاً، كل ما ستحتاجه هو تغيير في طريقة عرض البيانات، حيث أن المصفوفة تحتوي على اسم مفتاح لكل حقل مثل name,age... لذا سيكون الكود كالآتي: $itemArray = array(); foreach ($a->getDetails() as $b) { if ($b->getValue1() !== $b->getValue2()) { if (!array_key_exists($b->getId(), $itemArray)) { $itemArray[$b->getId()] = array('name' => $b->getName(), 'age' => $b->getAge()); } } } if (count($itemArray) > 0) { foreach($itemArray as $item) { $personName = $item['name']; $personAge = $item['age'] ; $content = ('Name is: ' . $personName . ', age is: ' . $personAge); } }
-
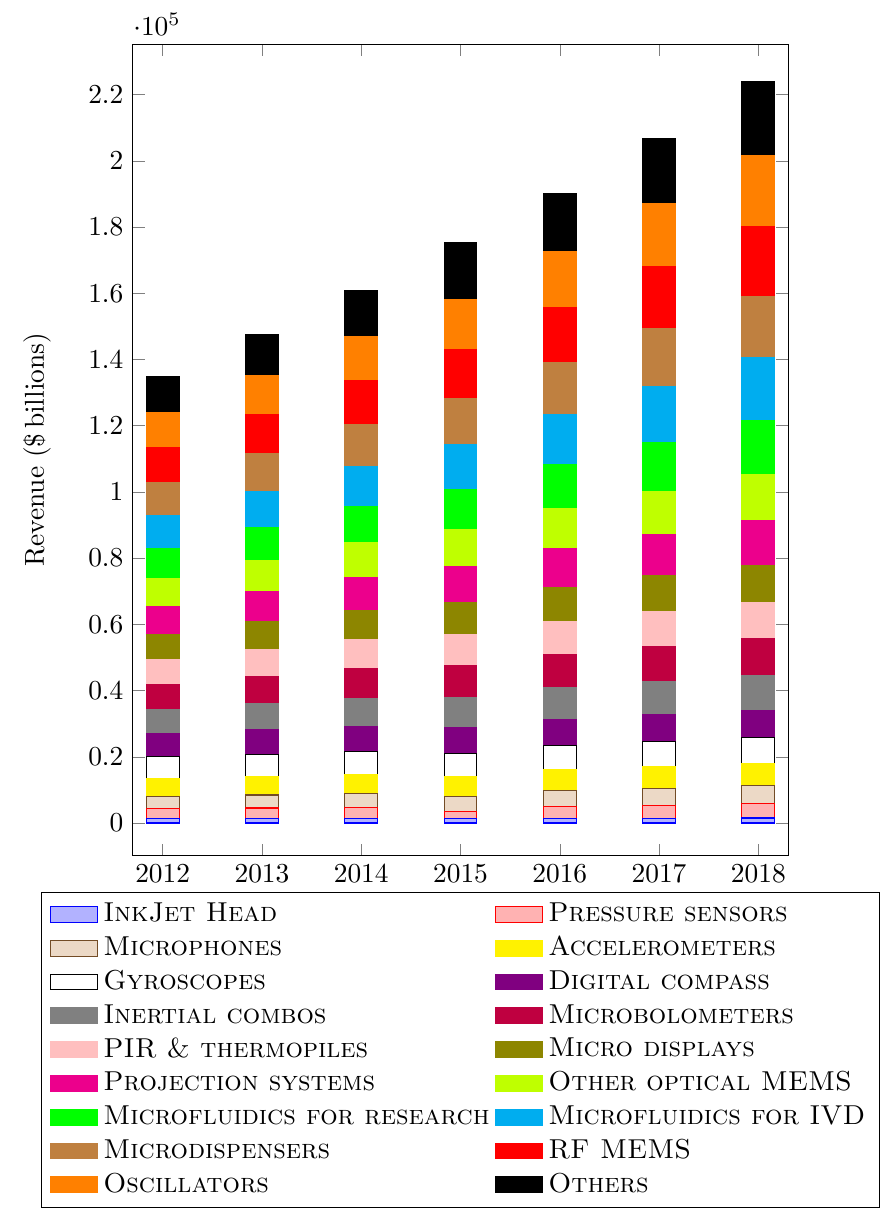
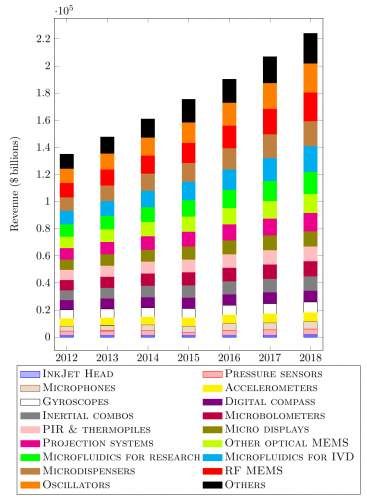
الخطأ كان في تحديد مكان المفتاح، حيث أنه يظهر افتراضيا بجانب المبيان، لذا كان من الواجب إضافة سطر فارغ ليتمكن من الظهور في الأسفل. الكود بعد التصحيح: \documentclass[border=10pt]{standalone} \usepackage{pgfplots} \begin{document} \begin{tikzpicture} \begin{axis}[ybar stacked, legend style={ % this is modified legend cell align=left, % legend columns=2, % at={(xticklabel cs:0.5)}, % anchor=north % up to here }, area legend, x tick label style={ /pgf/number format/1000 sep=}, ylabel=Revenue (\$\,billions), enlargelimits=0.05,width=10cm,height=12cm, bar width=12pt, ] \addplot coordinates {(2012,1388) (2013,1388) (2014,1388) (2015,1388) (2016,1388) (2017,1388) (2018,1500)}; \addlegendentry{\textsc{InkJet Head}} \addplot coordinates {( 2012 , 2995 ) ( 2013 , 3144.75 ) ( 2014 , 3294.5 ) ( 2015 , 2126.45 ) ( 2016 , 3594 ) ( 2017 , 3893.5 ) ( 2018 , 4342.75 ) }; \addlegendentry{\textsc{Pressure sensors}} \addplot coordinates {( 2012 , 3594 ) ( 2013 , 3923.45 ) ( 2014 , 4193 ) ( 2015 , 4432.6 ) ( 2016 , 4792 ) ( 2017 , 5091.5 ) ( 2018 , 5450.9 ) }; \addlegendentry{\textsc{Microphones}} \addplot [color=yellow, fill=yellow] coordinates {( 2012 , 5361.05 ) ( 2013 , 5450.9 ) ( 2014 , 5690.5 ) ( 2015 , 5960.05 ) ( 2016 , 6289.5 ) ( 2017 , 6529.1 ) ( 2018 , 6738.75 )}; \addlegendentry{\textsc{Accelerometers}} \addplot [color=black, fill=white] coordinates {( 2012 , 6648.9 ) ( 2013 , 6888.5 ) ( 2014 , 7128.1 ) ( 2015 , 7188 ) ( 2016 , 7457.55 ) ( 2017 , 7637.25 ) ( 2018 , 7787 )}; \addlegendentry{\textsc{Gyroscopes}} \addplot [color=violet, fill=violet] coordinates {( 2012 , 6948.4 ) ( 2013 , 7337.75 ) ( 2014 , 7547.4 ) ( 2015 , 7727.1 ) ( 2016 , 7787 ) ( 2017 , 8086.5 ) ( 2018 , 8236.25 )}; \addlegendentry{\textsc{Digital compass}} \addplot [color=gray, fill=gray] coordinates {( 2012 , 7337.75 ) ( 2013 , 7906.8 ) ( 2014 , 8445.9 ) ( 2015 , 9164.7 ) ( 2016 , 9584) ( 2017 , 10033.25 ) ( 2018 , 10482.5 ) }; \addlegendentry{\textsc{Inertial combos}} \addplot [color=purple, fill=purple] coordinates {(2012,7487.5) (2013,8176.35) (2014,8835.25) (2015,9494.15) (2016,10033.25) (2017,10632.25) (2018,11021.6)}; \addlegendentry{\textsc{Microbolometers}} \addplot [color=pink, fill=pink] coordinates {( 2012 , 7547.4 ) ( 2013 , 8236.25 ) ( 2014 , 8850.225 ) ( 2015 , 9509.125 ) ( 2016 , 10048.225 ) ( 2017 , 10647.225 ) ( 2018 , 11081.5 ) }; \addlegendentry{\textsc{PIR \& thermopiles}} \addplot [color=olive, fill=olive] coordinates {( 2012 , 7562.375 ) ( 2013 , 8251.225 ) ( 2014 , 8865.2 ) ( 2015 , 9524.1 ) ( 2016 , 10063.2 ) ( 2017 , 10662.2 ) ( 2018 , 11096.475 ) }; \addlegendentry{\textsc{Micro displays}} \addplot [color=magenta, fill=magenta] coordinates {( 2012 , 8386 ) ( 2013 , 9134.75 ) ( 2014 , 10033.25 ) ( 2015 , 10886.825 ) ( 2016 , 11740.4 ) ( 2017 , 12608.95 ) ( 2018 , 13477.5 ) }; \addlegendentry{\textsc{Projection systems}} \addplot [color=lime, fill=lime] coordinates {( 2012 , 8685.5 ) ( 2013 , 9434.25 ) ( 2014 , 10332.75 ) ( 2015 , 11081.5 ) ( 2016 , 12129.75 ) ( 2017 , 12938.4 ) ( 2018 , 13926.75 ) }; \addlegendentry{\textsc{Other optical MEMS}} \addplot [color=green, fill=green] coordinates {( 2012 , 8985 ) ( 2013 , 10003.3 ) ( 2014 , 10931.75 ) ( 2015 , 12219.6 ) ( 2016 , 13417.6 ) ( 2017 , 14825.25 ) ( 2018 , 16472.5 ) }; \addlegendentry{\textsc{Microfluidics for research}} \addplot [color=cyan, fill=cyan] coordinates {( 2012 , 9823.6 ) ( 2013 , 10931.75 ) ( 2014 , 12129.75 ) ( 2015 , 13537.4 ) ( 2016 , 15124.75 ) ( 2017 , 16831.9 ) ( 2018 , 19018.25 ) }; \addlegendentry{\textsc{Microfluidics for IVD}} \addplot [color=brown, fill=brown] coordinates {( 2012 , 10123.1 ) ( 2013 , 11231.25 ) ( 2014 , 12579 ) ( 2015 , 14076.5 ) ( 2016 , 15723.75 ) ( 2017 , 17520.75 ) ( 2018 , 18419.25 ) }; \addlegendentry{\textsc{Microdispensers}} \addplot [color=red, fill=red] coordinates {( 2012 , 10482.5 ) ( 2013 , 11830.25 ) ( 2014 , 13327.75 ) ( 2015 , 14825.25 ) ( 2016 , 16622.25 ) ( 2017 , 18628.9 ) ( 2018 , 21114.75 ) }; \addlegendentry{\textsc{RF MEMS}} \addplot [color=orange, fill=orange] coordinates {( 2012 , 10542.4 ) ( 2013 , 11860.2 ) ( 2014 , 13447.55 ) ( 2015 , 14975 ) ( 2016 , 16921.75 ) ( 2017 , 19018.25 ) ( 2018 , 21564 ) }; \addlegendentry{\textsc{Oscillators}} \addplot [color=black, fill=black] coordinates {( 2012 , 10871.85 ) ( 2013 , 12279.5 ) ( 2014 , 13777 ) ( 2015 , 17071.5 ) ( 2016 , 17371 ) ( 2017 , 19617.25 ) ( 2018 , 22312.75 ) }; \addlegendentry{\textsc{Others}} %\legend{InkJet Head, Pressure sensors, Microphones, Accelerometers, Gyroscopes, Digital compass, Inertial combos, Microbolometers, PIR \& thermopiles, Micro displays, Projection systems, Other optical MEMS, Microfluidics for research, Microfluidics for IVD, Microdispensers, RF MEMS, Oscillators, Others} \end{axis} \end{tikzpicture} \end{document} النتيجة النهائية:
-
السيناريو المتوقع في مثل هذه الوظائف، هو تصفح الملف النصي عن طريق دالة التكرار forEach ثم إضافة العناصر إلى القائمة المنسدلة انطلاقا من الملف النصي. هذا المثال التطبيقي، يتيح لك عمل ذلك، حيث يتم التأكد من وجود الملف النصي قبل الشروع في تصفحه: الكود المختص بـ Combobox: <ComboBox x:Name="comboBox" HorizontalAlignment="Left" Margin="149,43,0,0" VerticalAlignment="Top" Width="120" IsEditable="True" ItemsSource="{Binding Items}" SelectedItem="{Binding SelectedItem}" Text="{Binding NewItem, UpdateSourceTrigger=LostFocus}"/> <ComboBox x:Name="comboBox1" HorizontalAlignment="Left" Margin="349,122,0,0" VerticalAlignment="Top" Width="120"/> الدالة المسؤولة عن إضافة القيم من الملف النصي: public partial class MainWindow : Window { private string _selectedItem; private ObservableCollection<string> ServerNames; private string fileLocation = @"C:\Temp\ServerNames.txt"; public MainWindow() { ServerNames = new ObservableCollection<string>(); if (File.Exists(fileLocation)) { var list = File.ReadAllLines(fileLocation).ToList(); list.ForEach(ServerNames.Add); } DataContext = this; InitializeComponent(); } public IEnumerable Items => ServerNames; public string SelectedItem { get { return _selectedItem; } set { _selectedItem = value; OnPropertyChanged("SelectedItem"); } } public string NewItem { set { if (SelectedItem != null) { return; } if (!string.IsNullOrEmpty(value)) { ServerNames.Add(value); SelectedItem = value; } } } protected void OnPropertyChanged(string propertyName) { var handler = this.PropertyChanged; handler?.Invoke(this, new PropertyChangedEventArgs(propertyName)); } public event PropertyChangedEventHandler PropertyChanged; private void Window_Closing(object sender, CancelEventArgs e) { if (!File.Exists(fileLocation)) { File.Create(fileLocation); } File.WriteAllLines(fileLocation, ServerNames); } }
-
تعتبر DataAdabter من بين الأدوات المتواجدة على بيئة Net. المهمة، والتي تلعب دوراً هاما، حيث تُمكن من ربط التطبيق مع مجموعة من مصادر البيانات. هنا في مثالك لم يتم ربط DataSet بـ DataAdapterـ لذا من البديهي ألا يعمل التطبيق. الحل: إضافة DataAdapter وملأ DataSet بها: dbCmd = DBConnection.GetDbCommand(sql); SqlDataAdapter da = new SqlDataAdapter(); da.SelectCommand = dbCmd; da.Fill(movieSet); مثال آخر من موقع msdn.microsoft.com: // Assumes that connection is a valid SqlConnection object. string queryString = "SELECT CustomerID, CompanyName FROM dbo.Customers"; SqlDataAdapter adapter = new SqlDataAdapter(queryString, connection); DataSet customers = new DataSet(); adapter.Fill(customers, "Customers");
-
صادفت نفس المشكل، وكان الخلل فقط في إعطاء الصلاحيات للملفات الموجود داخل نطامLaravel، وذلك لأني أستعمل Ubuntu كنظام تشغيل، وكان الحل هو بتغيير صلاحيات الملفات، كالآتي: Laravel 4: # Group Writable (Group, User Writable) $ sudo chmod -R gu+w app/storage # World-writable (Group, User, Other Writable) $ sudo chmod -R guo+w app/storage Laravel5: # Group Writable (Group, User Writable) $ sudo chmod -R gu+w storage # World-writable (Group, User, Other Writable) $ sudo chmod -R guo+w storage