لوحة المتصدرين


المحتوى الأكثر حصولًا على سمعة جيدة
المحتوى الأعلى تقييمًا في 04/26/23 in أجوبة
-
السلام عليكم انا مطور ورد برس ارغب بتطوير مهاراتي فيه في البداية ساقوم بمتابعة كورس ال PHP ولكن هل يمكنني الانتقال بعد ذلك مباشرة للورد برس ؟ ام يجب علي حضور تدريب ال LARAVEL2 نقاط
-
****تم حل المشكلة بفعل أحد الإخوة بالتعليقات شكرا لكل من ساعد اريد تغيير محاذاة موقع باستخدام إضافة stylus الخاصة بكروم ليبدأ نص الموقع من جهة اليمين بدلا من اليسار وقد حاولت إضافة Body{direction: rtl;} ولم تنفع2 نقاط
-
السلام عليكم عند اضافة صور يظهر لي هذا الخطا مع العلم اني استعمل spatie media library
.thumb.png.cb288376652af32581cbf0eafd7d5913.png) 2 نقاط
2 نقاط -
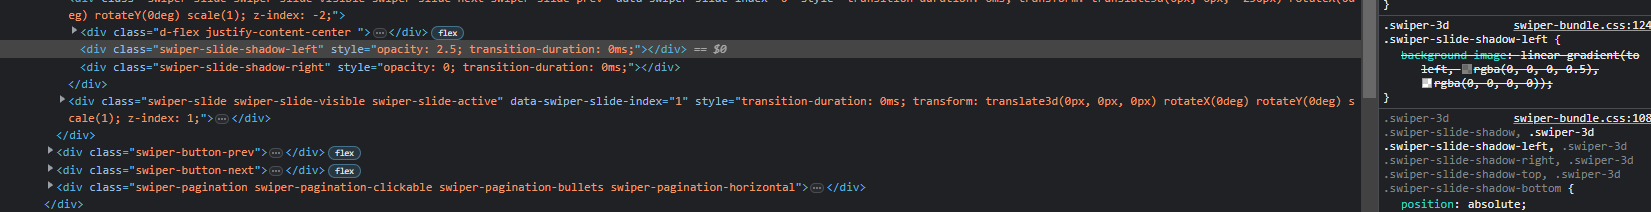
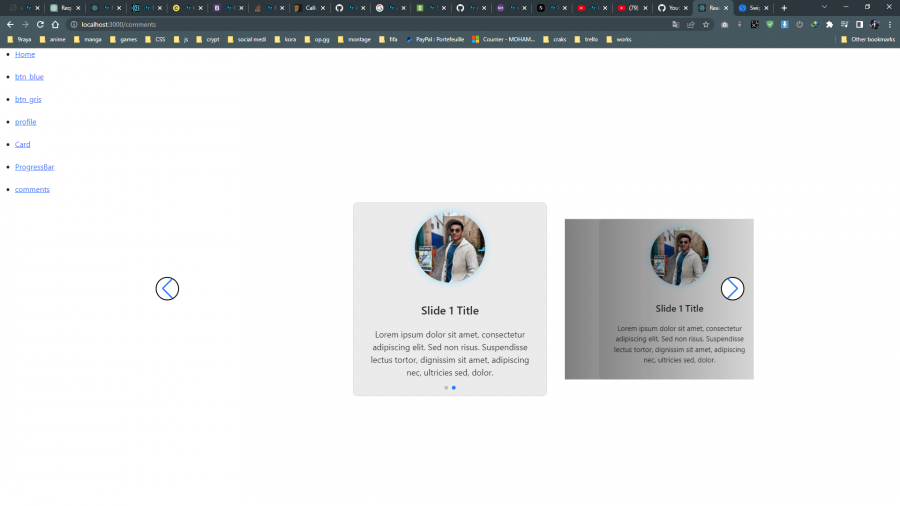
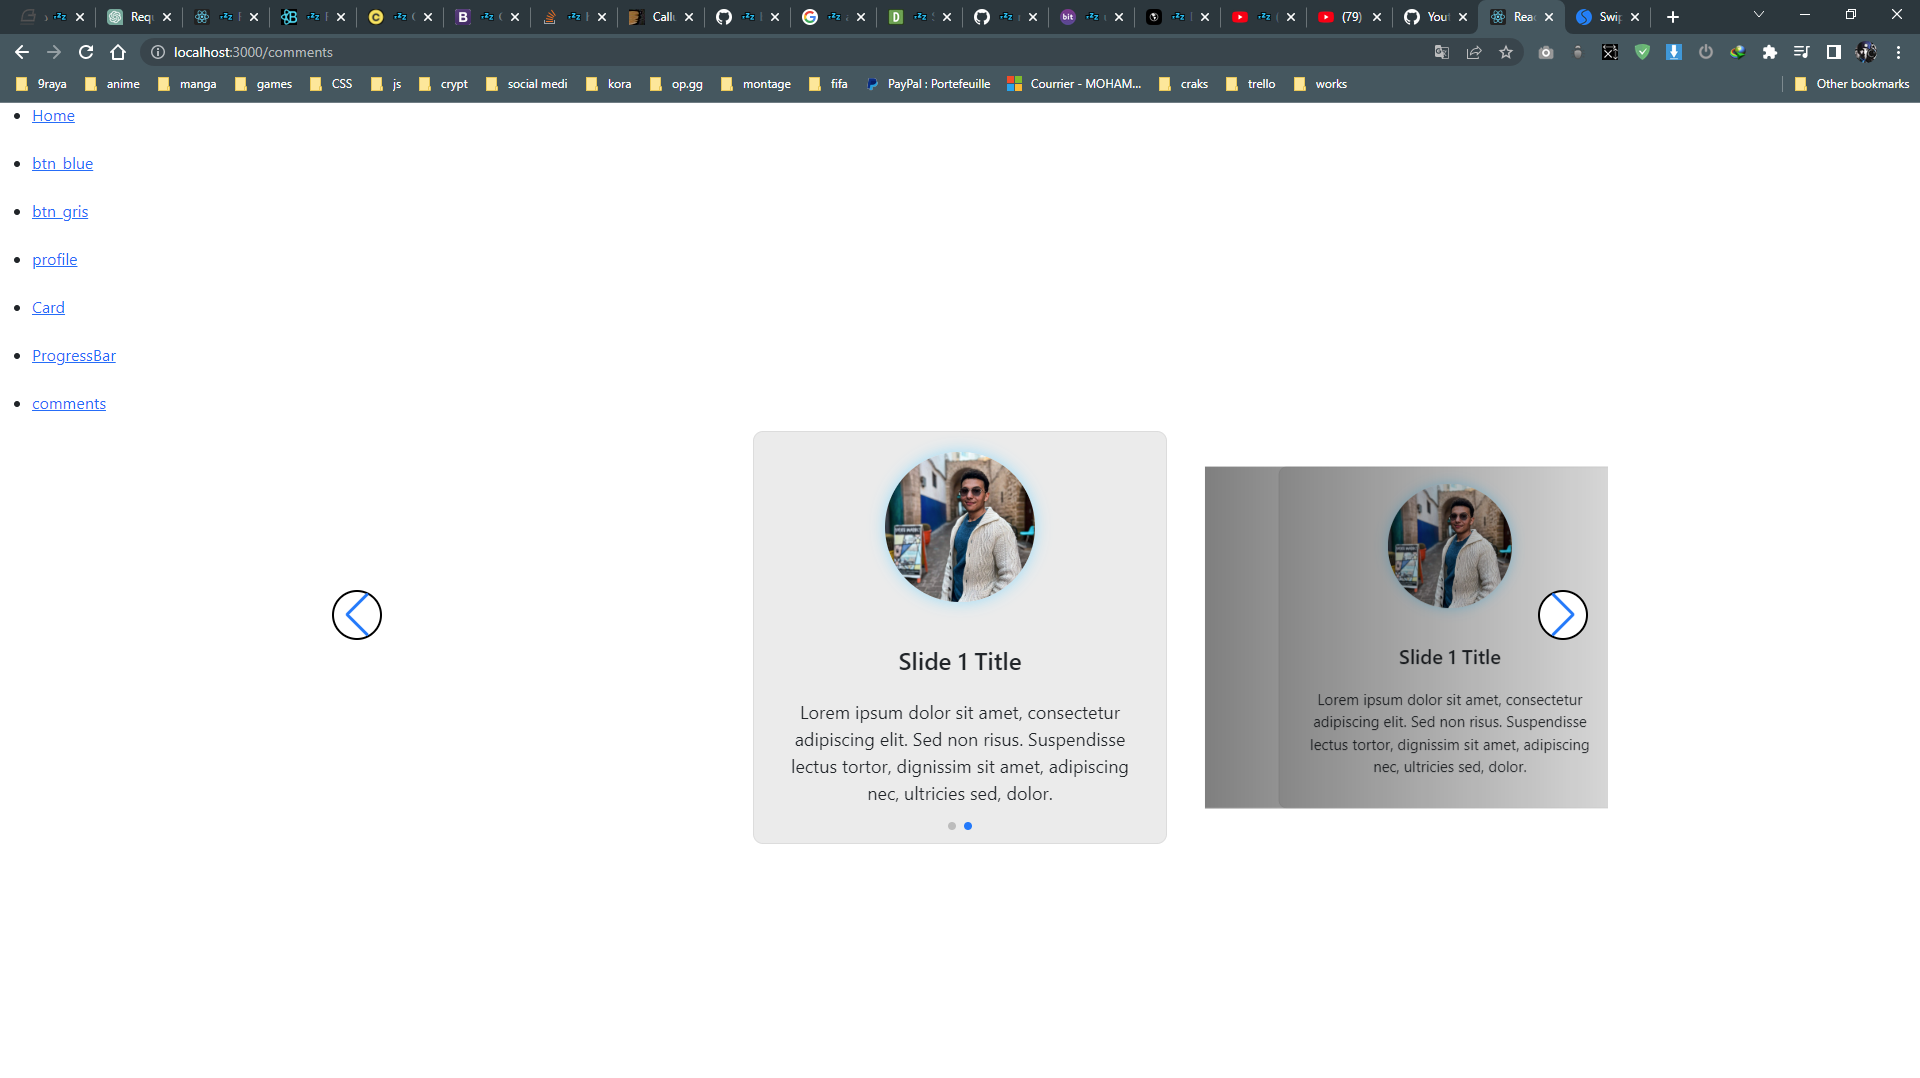
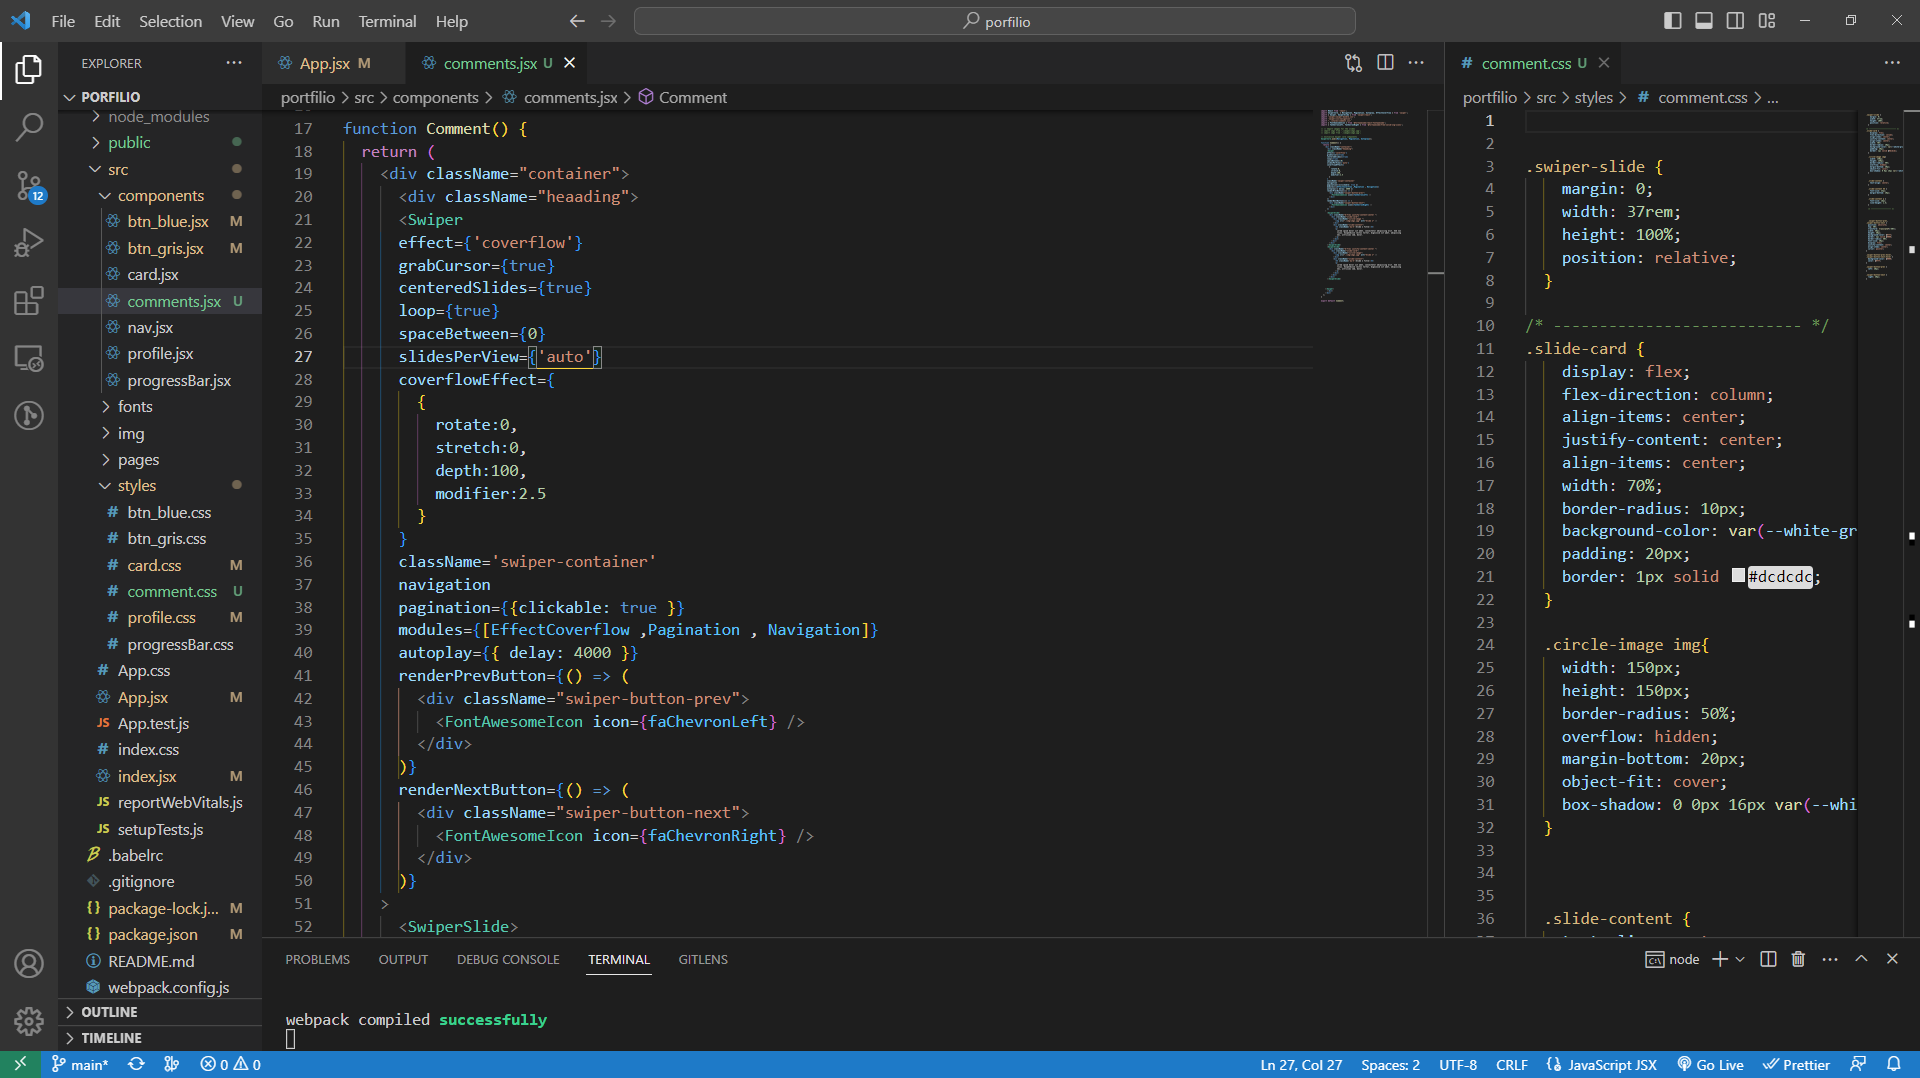
السلام عليكم لدي مشكلة صغيرة وهي من slidesperview حيث يظهر داك الجانب الرمادي كما تشاهدون اود ان ازيله ويبقى الشكل كما هو عليه كيفما فعلت اجد المنطقة الرمادية باslide على اليمين او باليسار وهي تظهر ك shadow رابط المشروع ب github : https://github.com/boumlik000/portfilioBM.git
 2 نقاط
 -
عايزة اعرف ايه الكورسات اللى ممكن اخدها علشان ادخل مجال العمل الحر وبتاخد اد ايه فالوقت وازاى اعرف احدد المهارة اللى ممكن اتعلمها علشان الشغل1 نقطة
-
السلام عليكم لدي ملف excel وأريد ان اعرف دقة هذا الملف من فضلك طريقة بسيطة لحساب accuracy مع العلم لدي Feature واحدة و Labels بها 0 او 11 نقطة
-
السلام عليكم لدي استفساران 1- كيف استعمل ploty.js مع العلم انا اعرف ولكنها تظهر عندما افتح المتصفح فقط وانا اريد اظهارها ف output ف VSCODE 2-كيف يممكني التحكم ف الجدول باستعمال امر مثل console.table كان اضع عنوان له وغيره الجدول ف output موضح بالصوره
.thumb.png.93eddab926f56b85a99c7bf20b44af66.png) 1 نقطة
1 نقطة -
1- لكي تظهر رسم بياني من Plotly.js في output في VSCode، تستطيع استخدام مكتبة "plotly-nodejs" والتي تسمح بإنشاء رسوم بيانية من Plotly.js دون الحاجة إلى فتح المتصفح. ولتثبيت هذه المكتبة باستخدام npm، اكتب الأمر التالي: npm install plotly-nodejs ثم يمكنك استخدام الكود التالي كمثال لإنشاء رسم بياني من Plotly.js وطباعته في output في VSCode: const plotly = require('plotly-nodejs'); const data = [ { x: [1, 2, 3], y: [4, 5, 6], type: 'scatter' } ]; const layout = { title: 'My Plotly Chart' }; plotly.plot(data, layout).then((figure) => { console.log(figure); }).catch((err) => { console.error(err); }); 2- لا يمكن التحكم في جدول Console باستخدام أوامر Console مثل console.table لأنها تتحكم فقط في كيفية طباعة البيانات في Console. ومع ذلك، تستطيع استخدام مكتبات Node.js مثل "cli-table" لإنشاء جداول مع تحكم كامل في التنسيق والعرض. ولتثبيت هذه المكتبة باستخدام npm، اكتب الأمر التالي: npm install cli-table وتستطيع استخدام الكود التالي كمثال لإنشاء جدول وطباعته في output في VSCode: const Table = require('cli-table'); const table = new Table({ head: ['Name', 'Age', 'Gender'], style: { head: ['green'], border: ['white'] } }); table.push( ['John', 30, 'Male'], ['Jane', 25, 'Female'], ['Bob', 45, 'Male'] ); console.log(table.toString());1 نقطة
-
نعم نفعت شكرا جزيلا لك غلبتك معي ❤️❤️❤️❤️❤️1 نقطة
-
لم تنفع لانه لا يمكن إضافة html ل stylus يجب أن تكون css واللغة كورية وليست إنجليزية1 نقطة
-
يتم إضافة shadow تلقائيًا على الشرائح في swiper أو للدقة يتم إضافة linear-gradient من خلال خاصية background-image فكما ترى في الصورة هناك كلاس باسم: swiper-slide-shadow-left swiper-slide-shadow-right وهو المسؤول عن إضافة الظل الذي تراه، ولحل تلك المشكلة، يمكنك استخدام التنسيق التالي في ملف App.css لديك: .swiper-slide-shadow-left, .swiper-slide-shadow-right { background-image: none !important; }
 1 نقطة
 -
أنا أكره النصائح المكتلجة أي العامة والتي لا تصلح للجميع بدون معرفة تفاصيلهم الشخصية، حيث أن بعض النصائح قد تضر والمقصود هو الإفادة! وسأحاول نصيحتك بدون أن أضرك، في البداية أن تسير مع القطيع أفضل لك من تسير عكس التيار، فالأمر بحاجة إلى مجهود عظيم أنت في غنى عنه ولا أعرفك شخصيًا هل ستتحمل ذلك أم لا. نصيحة غريبة صحيح؟ أتفهم ذلك، لكن من تجربة واقعية أن تقوم بفعل ما يفعله الجميع بشكل روتيني أفضل لك من أن تقوم بمحاولة تشكيل الواقع تبعًا لما تريده أنت. أي لا تقم بالتركيز على أي شيء آخر غير الدراسة في الوقت الحالي، وفي فترة الأجازة قم بتعلم البرمجة إن كنت صادقًا فعلاً في تعلمها. وبعد الإنتهاء من الثانوية العامة سيتحدد مصيرك الأكاديمي فإما بكلية جيدة ولها مستقبل أو كلية شهادة فقط، والشهادة هامة جدًا في عالمنا العربي لا تستهن بها. وأنصحك بالإجتهاد للحصول على مجموع يؤهلك لدخول كلية حاسبات ومعلومات، حيث ستقطع أشواطًا وتسهل على نفسك الأمر في تعلم البرمجة وستجد حافز كبير وأصدقاء لهم نفس الهدف أيضًا، وهو أمر عظيم. ودائمًا في حياتك ضع أولويات، فمثلاً الدراسة لها وقت محدد وتنتهي، أي أنك لو لم تجتهد لفشلت دراسيًا وفوت على نفسك فرص جيدة لمستقبلك. وتأني ولا تستعجل وقارن نفسك بنفسك فقط وليس بالآخرين، وأنت أدرى بظروفك، ولكن لا تتكاسل، ولا تشغل بالك بأمور كثيرة خاصة بالمستقبل فتفشل في حاضرك ومستقبلك، بل ركز على ما ستفعله خلال فترة سنة إلى سنتين. ولا تشغل بالك كثيرًا بالرزق، فقط إجتهد في المذاكرة وتطوير نفسك في فترات فراغك من الدراسة، وأيضًا اختر أصدقائك جيدًا، فصدقني أنت هو متوسط أقرب 5 أشخاص لك وشخصيتك ستتشكل بناءًا على ذلك وأفعالك وتفكيرك أيضًا، فاخترهم جيدًا.1 نقطة
-
مرحبا محمد، لا يجب الاستعجال في التأسيس وتعلم البرمجة. فبدلاً من توفير الوقت، قد تؤدي العجلة في تعلم البرمجة إلى الفشل بالكلية. إذ أن تعلم البرمجة يتطلب الكثير من الممارسة والتدريب، وليس مجرد الحصول على معرفة نظرية. بالإضافة إلى ذلك، قد تؤدي العجلة في تعلم البرمجة إلى تجاهل بعض الأساسيات التي يمكن أن تكون أساسًا قويًا لتطوير مهارات البرمجة في المستقبل، هذا بجانب ان طبيعة هاته المفاهيم البرمجية في الغالب هي التجريد، الأمر الذي يحتاج بعض الوقت ليتم استعيابه وتعوده. لذلك، فهو من الأفضل أن تأخذ الوقت الكافي لتعلم الأساسيات ومن ثم البدء في تطوير مهارات البرمجة بشكل أعمق. يمكنك البحث عن الموارد المجانية على الإنترنت والتعلم عن طريق الكتب أو الدورات الإلكترونية. كما ينبغي أن تتدرب بانتظام وتحاول إنشاء بعض المشاريع الصغيرة التي تساعدك على تحسين مهاراتك في البرمجة. بشأن قرار صديقك بترك الدراسة الثانوية والانتقال إلى مجال البرمجة، يمكن أن يكون هذا الخيار مناسبًا لبعض الأشخاص ولكنه ليس مثاليًا للجميع. فالدراسة الجامعية وتحصيل شهادة في الحوسبة أو البرمجة قد يمنحك مهارات أكثر تخصصًا وأساسًا قويًا للعمل في هذا المجال.1 نقطة

.png.41ac3d043367234a950565e108440148.png)


.png.398f6e55b98013c898c4dd96b554b641.png)