


Ali Ahmed55
-
المساهمات
2093 -
تاريخ الانضمام
-
تاريخ آخر زيارة
-
عدد الأيام التي تصدر بها
14
نوع المحتوى
ريادة الأعمال
البرمجة
التصميم
DevOps
التسويق والمبيعات
العمل الحر
البرامج والتطبيقات
آخر التحديثات
قصص نجاح
أسئلة وأجوبة
كتب
دورات
كل منشورات العضو Ali Ahmed55
-
السلام عليكم لماذا يُعتبر الانحدار اللوجستي في الأساس شبكة عصبية بسيطة جدًا ؟
- 2 اجابة
-
- 1
-

-
 السلام عليكم فيه حاجه غريب جدا في الكود ده هو ازي مش بيمسح القيمه الفارغ هي عبار عن دي ' ' ؟ ده الكود na_value = ['','Not tested' , 'Not done' , 'Other' , 'TBD cytogenetics' , 'N/A - disease not classifiable' , 'TBD', 'TBI +- Other, unknown dose' , 'N/A, F(pre-TED) not submitted' , 'No drugs reported'] data_train = pd.read_csv("equity-post-HCT-survival-predictions/train.csv" , na_values=na_value) ودي النتجيه (28800, 60) (1654, 60) و لو شلت ال ' ' من تغير الna_value بتكون بردو زي ماهي طيب ازي مع ان فيه قيمه null كثير زي دي
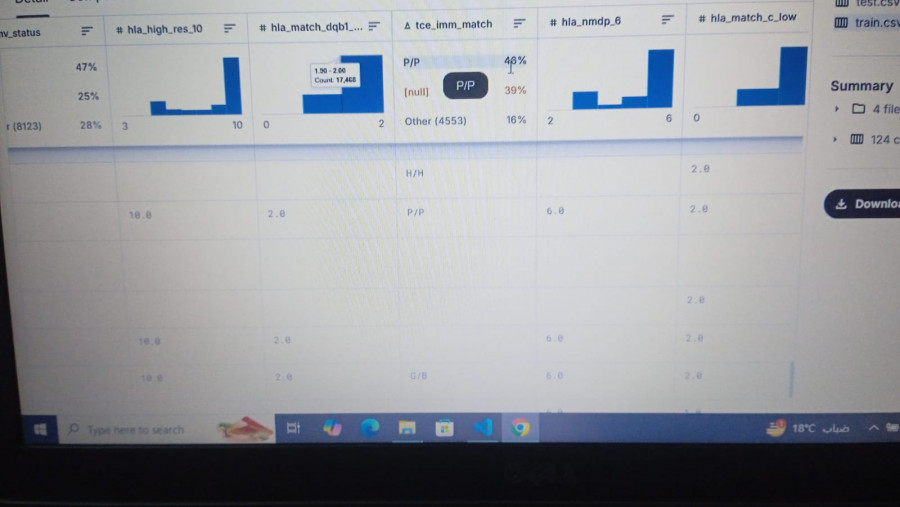
-
السلام عليكم هو مسح صفوف كثير بسيب ان فيه بيانات مفقود مش ده ممكن يسبيب تحيزه اثناء تدريب النموذح وكمان مش ممكن ياثير علي تحليل البيانات دي ؟
-
حتي لو كانت مسابقه علي كاغل فيه جوايز ماليه ؟ يعني مش ممكن هما يستخدمو النموذج علي 11 بدل 10
- 5 اجابة
-
- 1
-
-
السلام عليكم هو لو فيه عمود انا مسحتو في بيانات التدريب هل يفضل بردو امسحو من بيانات الاختبار ؟ مع العلم انا العمود في بيانات التدريب فيه بيانات ناقصه كثير جدا جدا عشان كده انا مسحتو العمود عكس بقا في بيانات الاختبار واي تاثير ده علي النموذج لو انا ممسحتش العمود في الاختبار ؟
- 5 اجابة
-
- 2
-
-
اه عشان كده الناس كتبني النموذج فقط من غير تحليل البيانات الف شكرااا جدا جدا لحضرتكم
-
السلام عليكم في مسابقات Kaggle التي تقدم جوائز مالية هل يتم مراجعت الكود ككل والا جزاء معين من الكود فقط ؟
- 3 اجابة
-
- 2
-
-
الف شكرااا لحضرتك جدا
-
السلام عليكم هو اي الفرق مابين الSymPy و numpy ؟
- 2 اجابة
-
- 1
-
-
الف شكرااا جدا لحضرتك
-
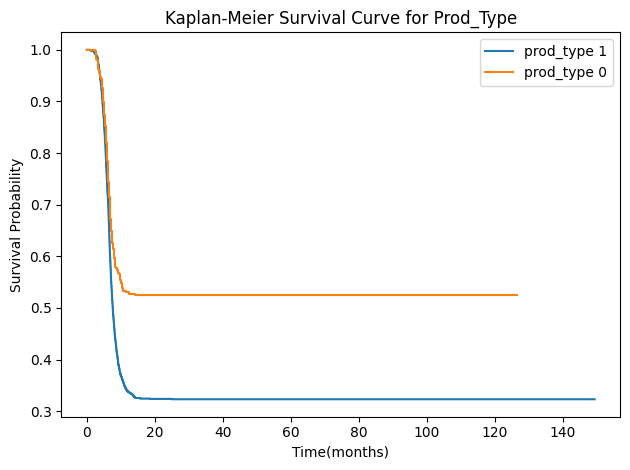
الف شكراااا جدا جدا لحضرتك بس انا عملت داله ودي الكود # Function to plot Kaplan-Meier survival curve for any categorical group def plot_kaplan_meier(group_column , plot_title): kaplanmeierfitter = KaplanMeierFitter() # Loop through each unique value of the group column for group in data_train[group_column].unique(): # Filter the data for the current group group_data = data_train[data_train[group_column] == group] # Fit the Kaplan-Meier estimator kaplanmeierfitter.fit(group_data['efs_time'], event_observed=group_data['efs'], label=f"{group_column} {group}") # Plot the survival function kaplanmeierfitter.plot_survival_function(ci_show=False) # Set the title and labels for the plot plt.title(plot_title) plt.xlabel("Time(months)") # Label for the x-axis plt.ylabel("Survival Probability") # Label for the y-axis # Adjust the layout to avoid clipping plt.tight_layout() #plt.savefig("Distribution-of-Survival-Analysis-Prod_Type.png" , bbox_inches='tight') # Save or show the plot plt.show()
-
السلام عليكم هو انا ازي اقدر افهم المحني الKaplan-Meier Survival ؟
- 4 اجابة
-
- 2
-
-
السلام عليكم هو اختبار Cramér's V بستخدم الدله max والا min عشان احصل علي قيمه k ؟ دي الكود # Create a contingency table using the specified columns from the dataset ('data1' and 'data2'). contingency_table = pd.crosstab(data_train[data1], data_train[data2]) # Perform the Chi-squared test using the contingency table. chi2_stat, p_value, dof, expected = chi2_contingency(contingency_table) # Calculate Cramér's V n = np.sum(contingency_table) # Total number of observations print(n) k = min(contingency_table.shape) # Use the largest dimension of the table to calculate Cramér's V v = np.sqrt(chi2_stat / (n * (k - 1)))
- 3 اجابة
-
- 2
-
-
السلام عليكم هو اي الافضل لتقليل التحيزه اثناء تدريب النموذج الشبكات العصبيه ام خورزميات تعلم الاله التقليدي ؟
- 2 اجابة
-
- 1
-
-
تمام جدا الف شكرااا لحضرتك جزاك الله كل خير
- 2 اجابة
-
- 1
-

-
السلام عليكم هو اي الBroadcasting in Python ؟
- 2 اجابة
-
- 1
-
-
انا الحمد الله بتدا اقراء اورق بحثيه لجيفري هينتون كلام حضرتك صح جدا جدا الف شكرااا لحضرتك جدا جدا جزاك الله كل خير
- 2 اجابة
-
- 1
-
-
السلام عليكم هو ازي اقدر ان ابدع او ابتكار حاجه جديد وانا بستخدم الادوات الجاهز زي tensorflow عند بناء شبكه عصبيه ؟
- 2 اجابة
-
- 1
-
-
الف شكراا لحضرتكم جدا
