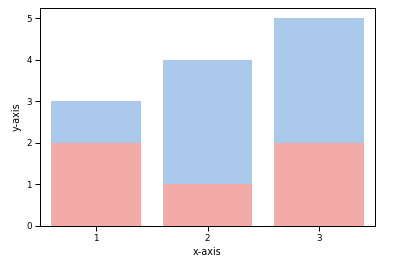
إياد أحمد نشر 24 ديسمبر 2021 أرسل تقرير نشر 24 ديسمبر 2021 لدي البيانات التالية: df = pd.DataFrame({ 'A': [10, 32, 14], 'B': [60, 22, 34], 'C': [21, 50, 5] }) وأريد استخدام barplot لرسم كل من: x=df["A"] && y=df["B"] و x=df["A"] && y=df["C"] بحيث تكون المخططات متداخلة أي مثلاً كما في الصورة: 1 اقتباس
1 Ali Haidar Ahmad نشر 24 ديسمبر 2021 أرسل تقرير نشر 24 ديسمبر 2021 للقيام بذلك نقوم بإنشاء اثنين subplot على نفس المحور Axes كما يلي: import pandas as pd import seaborn as sns import matplotlib.pyplot as plt df = pd.DataFrame({ 'A': [10, 32, 14], 'B': [60, 22, 34], 'C': [21, 10, 5] }) # subplots تعريف ax=plt.subplots() # رسم المخططين على نفس المحور ax=sns.barplot(x=df["A"],y=df["B"],color = 'black') ax=sns.barplot(x=df["A"],y=df["C"],color = 'green') # تحديد أسماء للمحاور ax.set(xlabel="X", ylabel="Y") plt.show() الخرج: مثال آخر: import pandas as pd import seaborn as sns import matplotlib.pyplot as plt #creating dataframe df=pd.DataFrame({ 'A':[i for i in range(10,110,10)], 'B':[i for i in range(100,0,-10)], 'C':[i for i in range(10,110,10)] }) axes=plt.subplots() axes=sns.barplot(x=df["A"],y=df["B"],color = 'lime') axes=sns.barplot(x=df["A"],y=df["C"],color = 'green') axes.set(xlabel="x-axis", ylabel="y-axis") plt.show() 1 اقتباس
السؤال
إياد أحمد
لدي البيانات التالية:
وأريد استخدام barplot لرسم كل من:
x=df["A"] && y=df["B"]و
x=df["A"] && y=df["C"]بحيث تكون المخططات متداخلة أي مثلاً كما في الصورة:

1 جواب على هذا السؤال
Recommended Posts
انضم إلى النقاش
يمكنك أن تنشر الآن وتسجل لاحقًا. إذا كان لديك حساب، فسجل الدخول الآن لتنشر باسم حسابك.