


Ali Ahmed55
-
المساهمات
2088 -
تاريخ الانضمام
-
تاريخ آخر زيارة
-
عدد الأيام التي تصدر بها
14
نوع المحتوى
ريادة الأعمال
البرمجة
التصميم
DevOps
التسويق والمبيعات
العمل الحر
البرامج والتطبيقات
آخر التحديثات
قصص نجاح
أسئلة وأجوبة
كتب
دورات
كل منشورات العضو Ali Ahmed55
-
 شكرااا لحضرتك جدا
 -
تمام , ولكن انا الرسم البياني بتاعي كده اصل مش بين اي حاجه
-
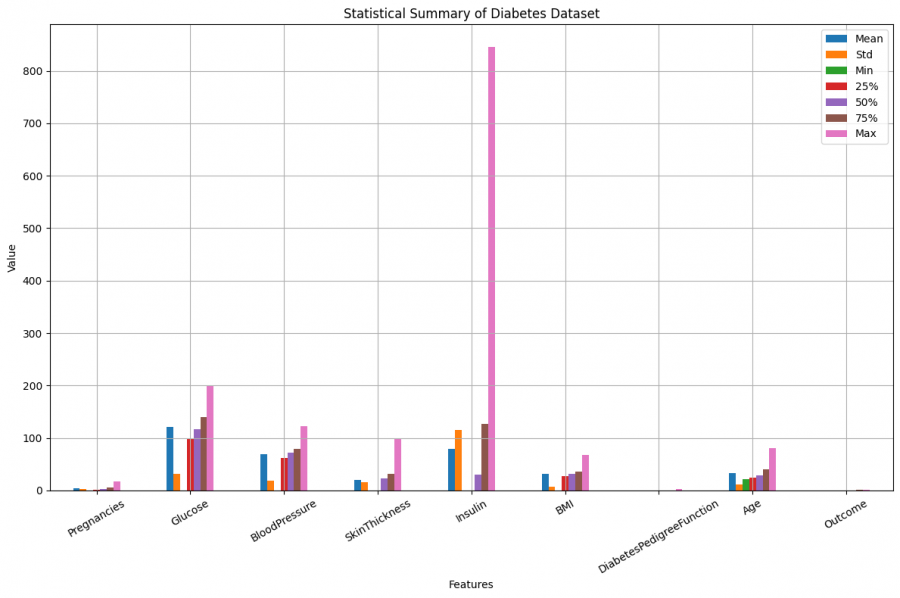
السلام عليكم هو عند عمل رسم بياني لعرض الإحصاءات بشكل مرئي، هل الافضل ان عمود زي الOutcome ميكونش موجود في العرض ؟
- 4 اجابة
-
- 1
-

-
وكمان عاوز اعرف اي الloc الف شكرااا لحضرتك جدا بس ممكن اعرف اي الميزه من كده يعني ؟ بس بجدا الف شكرااا يا أ.مصظفي الرسم شكل بقا جميل اووي
-
طيب و دي ؟
-
السلام عليكم عند عمل تشغيل الكود ده بيظهر الرسم البياناتي مره صور فارغ ومره صور فيه الرسم فا اي حل المكشله دي انا عاوز تظهر صوره الرسم فقط # Create a bar plot for statistics such as the mean and standard deviation. plt.figure(figsize=(12,11)) # Choose values to plot (eg mean and std) statistical[['mean' , 'std' , 'min' , "25%" , "50%" , "75%", 'max']].plot(kind='bar',figsize=(14,8)) plt.title("Statistical Summary of Diabetes Dataset") plt.xlabel("Features") plt.ylabel("Value") plt.legend(["Mean" , "Std" , "Min" , "25%" , "50%" , "75%" "Max"]) plt.show() ودي البيانات diabetes_clean.csv
- 4 اجابة
-
- 1
-
-
تمام , جدا شكراا لحضرتك
-
السلام عليكم جمعه مبارك هل يفضل ان اتعلم اي هو الdata visualization قبل ما اتعلم Matplotlib ؟ وهل فيه مكتبه اسهل من Matplotlib في باثيون ؟
- 2 اجابة
-
- 1
-
-
شكرااا جدا لحضرتك
-
السلام عليكم حسابي علي جوجل لما احاول اسجل عليا علي التلفون بيظهر رساله خطاء في كلمه السر مع ان كلمت السر صح فا فا حل المكشله دي ؟ مع العلم انا مش اول مر تحصل بيتحصل مع كثير وكل مره بيغير كلمه السر وايجي اسجل بعد فترا فا بيظر رساله خطاء ؟
- 1 جواب
-
- 1
-
-
شكراا جدا لحضرتكم
-
السلام عليكم هو اي الفرق مابين <> و != في الكودين دول ؟ WHERE all_bev <> carbonated_bev WHERE all_bev != carbonated_bev
- 5 اجابة
-
- 2
-
-
شكراا جدا لحضرتكم
-
السلام عليكم هو اي الTemporary tables في قواعد البيانات ؟
- 3 اجابة
-
- 2
-
-
شكراا لحضرتكم
- 5 اجابة
-
- 1
-
-
تمام , شكرااا لحضراتك
-
السلام عليكم هي افايد العلامه دي _ عند تعرف متغر في باثيون ؟ ليه بنعمل كده frist_name = 'ali' وليه مش كده firstname = 'ali'
- 5 اجابة
-
- 3
-
-
شكراا جدا لحضرتكم
- 3 اجابة
-
- 1
-
-
السلام عليكم هو اي الفرق مابين HAVING وبين WHERE في الSQL ؟
- 3 اجابة
-
- 2
-
-
ايوه طبعان والله علي فكره انا مهوس جدا بالبرمجه والكمبيوتر والرياضيات فا انا بهتم جدا بالماد التعلميه وعلي فكرا احلي حاجه بتعجبني بدورت حوجل لتحليلات البيانات الماده التعلميه مفيد جداجدا بجدا بتكلمو في حاجه محديش بيتكلم فيه
-
تمام , جدا شكراا جدا لحضرتكم انا دراست كورس cs50 بس ده كانت مقدمه ؟ فا كانت عاوز حاجه اعمق يعني ؟
- 4 اجابة
-
- 1
-
-
تمام , بس هل هكون موجود في مصر يعني هدرس عن بعد والا اي ؟
-
السلام عليكم انا عاوز اتطور مهارات مامبرمج انا مش عاوز بس ان اكتاب كود وخالص الا انا عاوز افهم ازي الكود ده هشتغل علي اي حهاز وهكذا فا انا عاوز اتعلم نظم التشغيل والشبكات فا اي الافضل شهادات جوجل الامن السبراني والا دعم تكنولوجيا المعلومات ؟
- 4 اجابة
-
- 2
-
