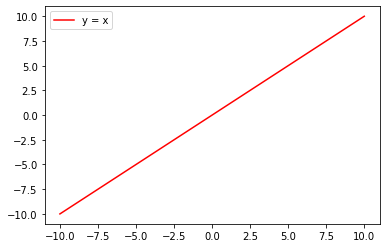
Ali Ismael نشر 25 أكتوبر 2021 أرسل تقرير نشر 25 أكتوبر 2021 كيف يمكنني تغيير نمط نقاط البيانات على الخط المرسوم التالي: import matplotlib.pyplot as plt import numpy as np x = np.linspace(-10, 10, 30) plt.plot(x, x,color="red") plt.legend(['y = x'], loc='upper left') plt.show() الخرج: 2 اقتباس
1 Ali Haidar Ahmad نشر 25 أكتوبر 2021 أرسل تقرير نشر 25 أكتوبر 2021 الدالة plot لديها بعض ال kwargs التي تعطيك القدرة على تنفيذ ماتحتاجه حيث يمكنك استخدام الوسيط linestyle لتحديد نمط الخط نفسه (الخط الواصل بين نقاط البيانات) و الوسيط marker لتغيير نمط نقاط البيانات. وهناك العديد من الأنماط التي يمكنك استخدامها لنقاط البيانات marker: ================ =============================== character description ================ =============================== - solid line style -- dashed line style -. dash-dot line style : dotted line style . point marker , pixel marker o circle marker v triangle_down marker ^ triangle_up marker < triangle_left marker > triangle_right marker 1 tri_down marker 2 tri_up marker 3 tri_left marker 4 tri_right marker s square marker p pentagon marker * star marker h hexagon1 marker H hexagon2 marker + plus marker x x marker D diamond marker d thin_diamond marker | vline marker _ hline marker ================ =============================== والخط linestyle: lineStyles '-' : '_draw_solid' '--' : '_draw_dashed' '-.' : '_draw_dash_dot' ':' : '_draw_dotted' 'None' : '_draw_nothing' ' ' : '_draw_nothing' '' : '_draw_nothing' مثال: import matplotlib.pyplot as plt import numpy as np x = np.linspace(-10, 10, 30) plt.plot(x, x,linestyle='--', marker='x',color="red") plt.legend(['y = x'], loc='upper left') plt.show() النتيجة: اقتباس
-1 Ahmed Sharshar نشر 25 أكتوبر 2021 أرسل تقرير نشر 25 أكتوبر 2021 هناك الكثير من أنماط الرسومات التي يمكنك استخدامها لرسم خط وهي باستخدام linestyle داخل plt.plot، هنا بعضا منها: أولا الخط المنقط ويمكنك رسمة ببساطة كالتالي: import matplotlib.pyplot as plt import numpy as np x = np.linspace(-10, 10, 30) plt.plot(x, x,color="red",linestyle='dotted') plt.legend(['y = x'], loc='upper left') plt.show() الناتج: أو تكون خطوطا صغيرا هكذا: import matplotlib.pyplot as plt import numpy as np x = np.linspace(-10, 10, 30) plt.plot(x, x,color="red",linestyle='dashdot') plt.legend(['y = x'], loc='upper left') plt.show() يمكنك كذلك استخدام ls وتمرير شكل الخط الذي تريده كرسم كالتالي: import matplotlib.pyplot as plt import numpy as np x = np.linspace(-10, 10, 30) plt.plot(x, x,color="red",ls='--') plt.legend(['y = x'], loc='upper left') plt.show() اقتباس
السؤال
Ali Ismael
كيف يمكنني تغيير نمط نقاط البيانات على الخط المرسوم التالي:
الخرج:

2 أجوبة على هذا السؤال
Recommended Posts
انضم إلى النقاش
يمكنك أن تنشر الآن وتسجل لاحقًا. إذا كان لديك حساب، فسجل الدخول الآن لتنشر باسم حسابك.