


Ali Ismael
-
المساهمات
96 -
تاريخ الانضمام
-
تاريخ آخر زيارة
نوع المحتوى
ريادة الأعمال
البرمجة
التصميم
DevOps
التسويق والمبيعات
العمل الحر
البرامج والتطبيقات
آخر التحديثات
قصص نجاح
أسئلة وأجوبة
كتب
دورات
أجوبة بواسطة Ali Ismael
-
-
استخدم مكتبة Pandas لتمثيل بياناتي بشكل رسومي. كيف يمكننا تسمية المحاور؟ مثلاً في الكود التالي:
import numpy as np
import pandas as pd
# إنشاء داتافريم مكون من عمودين
d = {'col_1' : np.arange(20),
     'col_2' : np.arange(20,60,2)**8}
df = pd.DataFrame(d)
# تمثيلهما  بيانياً
df.plot(x='col_1', y='col_2', style='-')
والنتيجة:
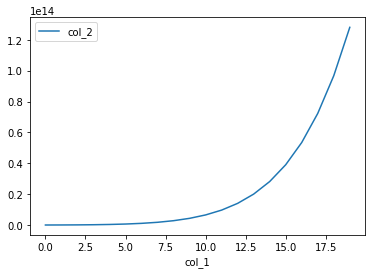
الآن أريد أن أضع تسميات للمحاور. كيف نقوم بذلك؟
-
 1
1
-
-
لدي الكود التالي:
import matplotlib.pyplot as plt
import numpy as np
x = np.linspace(-10, 10, 1000)
f=x**2+30
plt.plot(x, f, label="Gradient descent")
i = 0
j = 30
plt.plot(i, j, "ko",color="red", label="Global Optimum")
plt.xlabel("X")
plt.ylabel("Y")
plt.show()
والنتيجة:
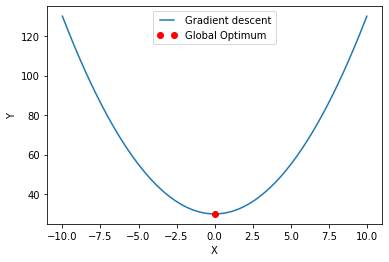
المشكلة أنني لا أريد أن تظهر نقطتين ضمن ال legend وإنما أريد نقطة واحدة فقط. كيف نقوم بذلك؟
-
1
-
-
عندما أقوم بحفظ الصورة التي تحوي الرسم البياني تظهر حولها هوامش بيضاء (مسافات فارغة بيضاء)، كيف يمكنني إلغاءها؟ حاولت ضبط bbox_inches على "tight" لكن لم ينجح الأمر؟
-
1
-
-
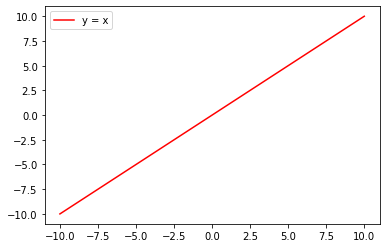
كيف يمكنني تغيير نمط نقاط البيانات على الخط المرسوم التالي:
import matplotlib.pyplot as plt
import numpy as np
x = np.linspace(-10, 10, 30)
plt.plot(x, x,color="red")
plt.legend(['y = x'], loc='upper left')
plt.show()
الخرج:
-
2
-
-
كيف يمكنني أن أضيف إطار إلى الصورة؟
-
1
-
-
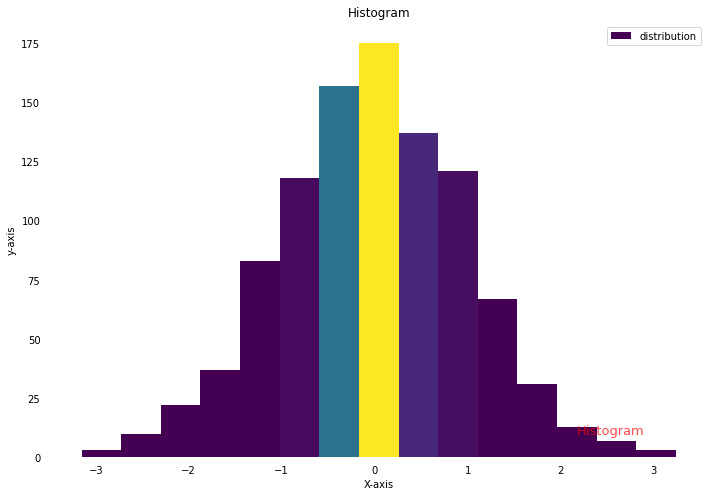
لقد قمت بتمثيل بياناتي، لكن أريد أن أضيف للرسم البياني شبكة grid، كيف نقوم بذلك؟
هذا هو الكود:import matplotlib.pyplot as plt import numpy as np from matplotlib import colors from matplotlib.ticker import PercentFormatter # إنشاء بيانات عشوائية N_points = 984 n_bins = 15 # إنشاء توزيع x = np.random.randn(N_points) y = .8 ** x + np.random.randn(984) + 25 legend = ['distribution'] # إنشاء الهيستوغرام fig, axs = plt.subplots(1, 1, figsize =(10, 7), tight_layout = True) #ticks حذف العلامات axs.xaxis.set_ticks_position('none') axs.yaxis.set_ticks_position('none') # إضافة نص للشكل fig.text(0.9, 0.15, 'Histogram', fontsize = 13,color ='red',ha ='right', va ='top',alpha = 0.7) # plot حذف خطوط حاويةال for s in ['top', 'bottom', 'left', 'right']: axs.spines[s].set_visible(False) #وضع مسافة بين التسميات وبين المحاور axs.xaxis.set_tick_params(pad = 4) axs.yaxis.set_tick_params(pad = 8) # إنشاء الهستوغرام N, bins, patches = axs.hist(x, bins = n_bins) # تحديد الألوان fracs = ((N**(9)) / N.max()) norm = colors.Normalize(fracs.min(), fracs.max()) for thisfrac, thispatch in zip(fracs, patches): color = plt.cm.viridis(norm(thisfrac)) thispatch.set_facecolor(color) # تسمية للمحاور plt.xlabel("X-axis") plt.ylabel("y-axis") plt.legend(legend) # عنوان plt.title('Histogram') # عرض plt.show()
وهذه هي النتيجة:
-
1
-
-
أريد تطبيق الدالة SimpleBlobDetector لكنها تتعامل مع الصور ذات المجال من 0 إلى 255 أي 8bit-image فقط، ولدي صورة رمادية ممثلة ب np.array وأريد تطبيق هذه الدالة عليها، فهل هناك طريقة لكي أقوم بالتحويل بشكل فعَال؟
-
1
-
-
أريد إجراء عملية عكس لبيانات الصورة الرمادية، فهل هناك طريقة للقيام بذلك في بايثون؟
-
1
-
-
كيف يمكن رسم دوائر فارغة لتمثيل نقاط البيانات باستخدام الدالة scatter؟ حيث قمت بالفعل برسم البيانات لكن أريد أن تكون نقاط البيانات مفرغة (أي بدون لون)؟
-
1
-
-
لدي صورة وأريد رسم مستطيل عليها، كيف يمكننا القيام بذلك في Matplotlib ؟
-
1
-
-
كيف يمكننا رسم خطوط ملونة مختلفة ضمن شكل واحد؟
-
1
-
-
كيف يمكننا التحكم بعدد علامات التجزئة التي تظهر في الرسم البياني في Matplotlib ؟
-
1
-
-
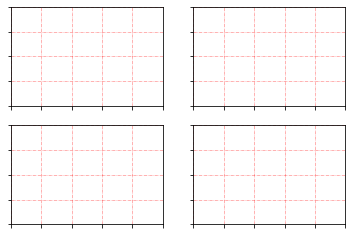
كيف يمكننا حذف الفراغات (الفجوات) بين ال subplots التي تظهر عند عرضها في الكود التالي:
import matplotlib.pyplot as plt
for i in range(4):
    axs = plt.subplot(2, 2, i+1)
    axs.grid(b = True, color ='red',
		linestyle ='-.', linewidth = 0.5,
		alpha = 0.6)
    axs.set_xticklabels([])
    axs.set_yticklabels([])
plt.show()
-
1
-
-
كيف يمكنني رسم الوقت (HH:MM:SS.mm) على المحور x والأرقام على المحور y باستخدام Matplotlib؟
-
1
-
-
كيف يمكنني إنشاء صورة RGB جديدة . لا أريد تحميل الصورة من ملف ، أريد إنشاء صورة فارغة جاهزة لإجراء العمليات عليها.
-
1
-
-
كيف يمكننا اكتشاف النص واستخراجه من الصور؟
-
1
-
-
كيف يمكنني حذف محور axis محدد من ال plot؟
-
1
-
-
هل هناك طريقة معينة في بايثون أو OpenCV لتدوير الصورة بدرجة معينة؟
-
1
-
-
كيف يمكننا تحويل الصورة من تنسيقOpenCV إلى تنسيق (Pillow )PIL والعكس؟
-
1
-
-
أريد كود يمكنني من قراءة الصورة من سلاسل byte string من قاعدة البيانات أو ملف؟
-
1
-
-
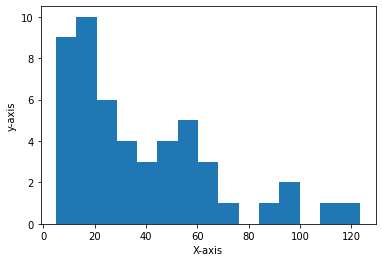
كيف يمكنني تغيير حجم ال bins، على سبيل المثال في الكود التالي:
from matplotlib.ticker import PercentFormatter
import matplotlib.pyplot as plt
import numpy as np
from matplotlib import colors
N_points = 200
n_bins = 15
x1 = abs(np.random.randn(N_points)*50)
plt.hist(x1,bins = n_bins)
plt.xlabel("X-axis")
plt.ylabel("y-axis")
plt.show()
-
1
-
-
استخدم googlecolab للتطبيق بعض الخوارزميات على الصور، لكن بمجرد محاولة استخدام الدالة cv2.imshow يظهر لي الخطأ التالي، على سبيل المثال:
import cv2
import numpy as np
img1 = cv2.imread(r'/content/test1 closedeye.jpg')
imageresult = cv2.cvtColor(img1, cv2.COLOR_BGR2HSV)
cv2.imshow('res',img1)
cv2.waitKey(0)
cv2.destroyAllWindows()
cv2.imwrite('d:\HSV.png',imageresult)
---------------------------------------------------------------------------

DisabledFunctionError                     Traceback (most recent call last)

<ipython-input-1-c9e483595677> in <module>()
      6 imageresult = cv2.cvtColor(img1, cv2.COLOR_BGR2HSV)
      7 # عرض الصورة الناتجة وتخزينها
----> 8 cv2.imshow('res',img1)
      9 cv2.waitKey(0)
     10 cv2.destroyAllWindows()

/usr/local/lib/python3.7/dist-packages/google/colab/_import_hooks/_cv2.py in wrapped(*args, **kwargs)
     50   def wrapped(*args, **kwargs):
     51     if not os.environ.get(env_var, False):
---> 52       raise DisabledFunctionError(message, name or func.__name__)
     53     return func(*args, **kwargs)
     54

DisabledFunctionError: cv2.imshow() is disabled in Colab, because it causes Jupyter sessions
to crash; see https://github.com/jupyter/notebook/issues/3935.
-
1
-
-
كيف يمكنني رسم خريطة حرارية في Matplotlib ؟
-
1
-
-
كيف يمكننا أن نقرأ ونستعرض صورة في Matplotlib ؟
-
1
-
مشكلة في استخدام الرمز n\ مع الدالة putText في OpenCV في بايثون
في بايثون
نشر
أحاول وضع هذا النص ' Yesterday I was clever.. \n so I wanted to change the world ' على الصورة من خلال الدالة putText، لكن عند عرض الصورة يظهر هكذا ' Yesterday I was clever.. ? so I wanted to change the world ' لكن كنت أتوقع أن تتم طباعة "so I wanted to change the world" في السطر الجديد لكن لم يتم التعرف على ال n\ فما المشكلة؟ هذا هو الكود: