


Ali Ismael
-
المساهمات
96 -
تاريخ الانضمام
-
تاريخ آخر زيارة
نوع المحتوى
ريادة الأعمال
البرمجة
التصميم
DevOps
التسويق والمبيعات
العمل الحر
البرامج والتطبيقات
آخر التحديثات
قصص نجاح
أسئلة وأجوبة
كتب
دورات
أجوبة بواسطة Ali Ismael
-
-
أحتاج لمعرفة حجم الشكل figure بواحدة البكسل في ماتبلوتليب؟
-
 1
1
-
-
كيف يمكننا أن نقوم بحذف subplot من ال Figure؟
-
1
-
-
أريد مثال يبين كيفية استخدام خوارزمية SIFT في OpenCV؟
-
2
-
-
على فرض لدينا الرسم البياني التالي:
import numpy as np
import matplotlib.pyplot as plt
x = range(15)
y = range(15)
p = plt.plot(x,y, x,y*2, x,y*3)
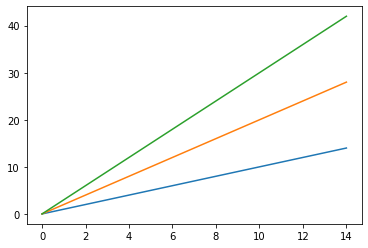
كيف يمكننا معرفة لون كل شكل في الرسم لتخزينه في متغير؟
-
1
-
-
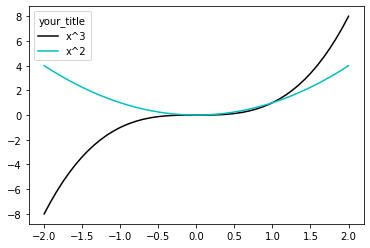
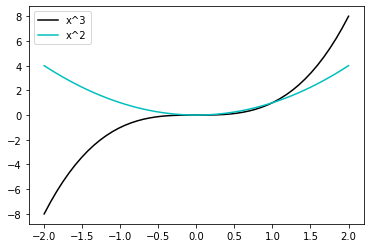
كيف يمكنني أن أجعل قيم المحور العمودي تبدأ من ال 0. هنا في الكود التالي:
import numpy as np
import matplotlib.pyplot as plt
x = np.linspace(-2, 2, 50)
y1 = x**3
y2 = x**2
fig, ax = plt.subplots()
ax.plot(x, y1, c = 'black',label = 'x^3')
ax.plot(x, y2, c = 'c',label = 'x^2')
leg = plt.legend(title="your_title")
plt.show()
-
1
-
-
أريد تحويل مصفوفة نمباي التي تمثل الصورة إلى bytes فهل هناك طريقة ما للقيام بذلك؟
-
2
-
-
استخدم الدالة createSelectiveSearchSegmentation لتنفيذ بعض عمليات البحث الانتقائي على الصور لكن ماسبب الخطأ التالي:
import cv2 as cv
from cv2.ximgproc.segmentation import createSelectiveSearchSegmentation
serach = createSelectiveSearchSegmentation()
--------------------------------------------------------------------------------------
Traceback (most recent call last):
  File "<stdin>", line 1, in <module>
AttributeError: module 'cv2.cv2' has no attribute 'ximgproc'
علماً أنني قمت بتجريب تثبيت حزمة opencv-contrib-python ولم ينجح الأمر.
-
1
-
-
أريد طريقة لتغيير ألوان المحاور في Matplotlib، على سبيل المثال في الكود التالي:
import numpy as np
import matplotlib.pyplot as plt
x = np.linspace(-2, 2, 50)
y1 = x**3
y2 = x**2
fig, ax = plt.subplots()
ax.plot(x, y1, c = 'black',label = 'x^3')
ax.plot(x, y2, c = 'c',label = 'x^2')
leg = plt.legend(title="your_title")
plt.show()
-
1
-
-
أتعلم حالياً التعامل مع مكتبة cv2 وأبحث عن دالة تساعدني في تقسيم الصورة إلى ثلاث صور لقنوات RGB وإعادة دمجها باستخدام CV2 في python؟
-
1
-
-
لدي مجموعة من النقاط الحدودية التي تمثل كائن، وأريد رسمه كإطار contour، كيف نقوم بذلك؟
-
1
-
-
لماذا يستخدم OpenCV فضاء الألوان BGR بدلاً من RGB علماً أن جميع الصور تقريباً تكون RGB؟ وهل هناك فرق بينهما أساساً؟
-
1
-
-
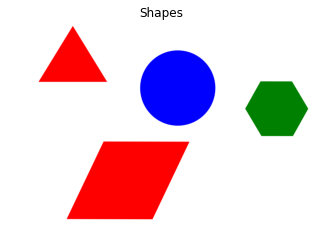
كيف يمكننا اكتشاف الأشكال الهندسية، مثلاً الموجودة في الصورة التالية:
-
1
-
-
لدي الكود التالي، وأريد زيادة عرض خط الأسطر الموجودة ضمن ال legend:
import numpy as np
import matplotlib.pyplot as plt
x = np.linspace(-2, 2, 50)
y1 = x**3
y2 = x**2
fig, ax = plt.subplots()
ax.plot(x, y1, linewidth=2.0, label='x^3')
ax.plot(x, y2, linewidth=2.0, label='x^2')
leg = ax.legend()
plt.show()
-
1
-
-
كيف يمكننا التلاعب بلون الخلفية والشفافية للرسم البياني؟
-
1
-
-
أقوم بعملية تطبيع Normalizing للصورة باستخدام الدالة cv2.normalize لتغيير نطاق قيم كثافة البكسل (أريد جعلها بين ال 0 وال 1)، وقمت بتطبيق خوارزمية NORM_L1 لكن لم ينجح الأمر؟ وتظهر الصورة سوداء بقيم صفرية.
import cv2
import Image
import numpy
myimage = cv2.imread('/content/test5 openeye.jpg',0)
img_normlaized=cv2.normalize(myimage,None,alpha=0,beta=1,norm_type=cv2.NORM_L1)
image = Image.fromarray(img_normlaized)
image.save("image.jpg")
-
1
-
-
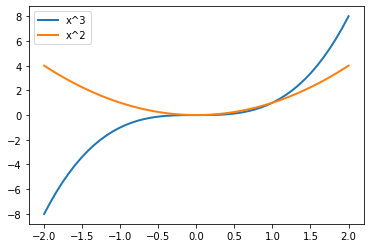
لدي الكود التالي وأريد وضع عنوان لل Legend فكيف نقوم بذلك؟
import numpy as np
import matplotlib.pyplot as plt
x = np.linspace(-2, 2, 50)
y1 = x**3
y2 = x**2
fig, ax = plt.subplots()
ax.plot(x, y1, c = 'black',label = 'x^3')
ax.plot(x, y2, c = 'c',label = 'x^2')
leg = plt.legend()
plt.show()
-
1
-
-
كيف يمكننا إيجاد صورة داخل صورة أخرى؟ على سبيل المثال لدي صورة وجه لشخص ما وأريد البحث عنها ضمن صورة تحتوي مجموعة من صور الوجوه الأخرى (ومن ضمنهم صورة وجهه)؟
-
1
-
-
أعمل على مهمة لتحديد حدقية العين، لذا أحتاج لرسم دائرة، فهل هناك دالة للقيام بذلك في بايثون أو OpenCV؟
-
1
-
-
كيف يمكننا زيادة سطوع الصورة brightness؟
-
1
-
-
كيف يمكننا إظهار الرسوم البيانية بعد أن نقوم بإنشائها؟
-
1
-
-
كيفية إزالة ال legend من ال plot؟
-
1
-
-
أنفذ بعض المهام في Matplotlib وأحتاج إلى طريقة تمكنني من عرض الصورة باستخدام الدالة imshow بالصيغة الرمادية؟
-
1
-
-
أحتاج إلى عرض ثلاث صور، إحداها بقناة حمراء كصورة حمراء ، وأخرى باللون الأزرق ، والأخيرة باللون الأخضر؟ كيف نقوم بذلك؟
-
1
-
-
هل هناك دوال جاهزة في OpenCV لإضافة ضجيج مثل الضجيج الغاوصي أو ضجيج الملح والفلفل salt and pepper إلى الصورة كما في الماتلاب؟
-
1
-
اكتشاف الخطوط العمودية والأفقية في الصورة باستخدام OpenCV في بايثون
في بايثون
نشر
أريد طريقة لاستخدامها في اكتشاف الخطوط العمودية والأفقية، واعتقد أن HoughLines هو الطريقة الأفضل، لذا أريد مثال لتوضيح استخدامه؟