


سعاد
-
المساهمات
177 -
تاريخ الانضمام
-
تاريخ آخر زيارة
نوع المحتوى
ريادة الأعمال
البرمجة
التصميم
DevOps
التسويق والمبيعات
العمل الحر
البرامج والتطبيقات
آخر التحديثات
قصص نجاح
أسئلة وأجوبة
كتب
دورات
أجوبة بواسطة سعاد
-
-
لدي كود Html التالي:
<input id="date_from" class="form-control input-sm" type="text" name="date_from" required> <input id="date_to" class="form-control input-sm" type="text" name="date_to" required>
وأريد الحصول على قيمة تاريخ يوم وذلك عن طريق التأكد ان القيمة تقع بين قيمتين، هذه محاولتي باستخدام Jquery:
function parseDate(str) { var mdy = str.split('/') return new Date(mdy[2], mdy[0]-1, mdy[1]); } function daydiff(first, second) { return Math.round((second-first)/(1000*60*60*24)); } $(document).ready(function(){ $("#date_to").change(function(){ alert(daydiff(parseDate($("#date_from").val())- parseDate($("#date_to").val()))); alert($("#date_from").val()); }); });
ما أحصل عليه هو القيمة Nan ، فكيف أفعلها؟
-
أعمل على التصميم باستخدام photoshop، المشكل الذي أصادفه هو ظهور شبكة بيضاء اللون عند عمل Zoom:
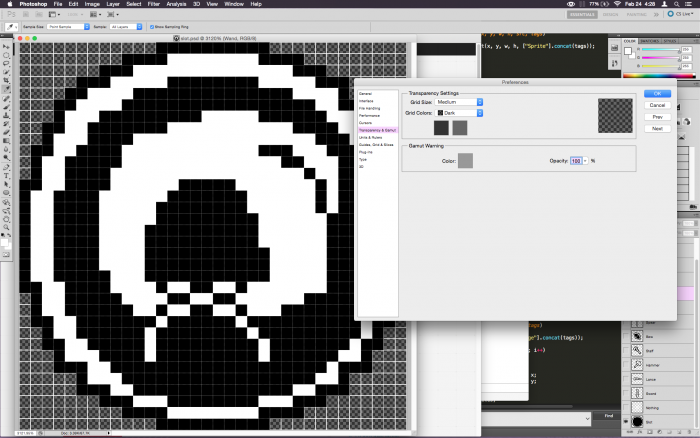
كيف أمنع ظهورها؟
-
على إطار العمل Rails لدي Models هما Article وَ Comment بعلاقة one-to-many.
الواجهة view:
<% @articles.each do |article| %> <% article.comments.each do |comment| %> some content <% end %> <% end %>جلب articles عن طريقة المتغير articles@ :
@articles = Article.order('created_at asc').last(4)أريد عمل فلتر للتعليقات داخل الواجهة:
<% @articles.each do |article| %> <% article.comments.order('created_at asc').last(4).each do |comment| %> some content <% end %> <% end %>
لكن لا أستطيع عمل (4)order('created_at asc').last داخل الواجهة، فكيف أتمكن من فعل ذلك داخل Controller؟
-
إليكم المثال التالي لحلقة التكرار على لغة البرمجة Ruby:
arr = [1, 2, 3] for elem in arr do puts elem end puts elem # => 3
مما سينتج عنه:
1 2 3 3
المتغير em يعطي القيمة الحالية لحلقة التكرار، لماذا تكررت القيمة 3 عند الطباعة ؟
-
كيف أعرف المتصفح المُستخدم ببرمجة Ruby و Selenium WebDriver؟
استعملت هذا الكود الذي وجت في أحد المواقع:
if $driver.kind_of? Selenium::WebDriver::Firefox # some code end
لكنه لا يعمل؟
-
على برنامج LaTeX، أحاول تحرير وثيقة بواسطة الكود التالي:
\documentclass{article} \usepackage{tikz} \begin{document} \begin{tikzpicture}[line join=round, x=1pt, y=1pt, thick] \draw (0,0) -- (30,0); \foreach \x in {2,...,9}{ \draw[yscale=2] (\x*15,0) -- (\x*15,50) -- (\x*15+7.5,50) -- (\x*15+7.5,-50) -- (\x*15+15,-50) -- (\x*15+15, 0); } \draw (150,0) -- (200,0); \end{tikzpicture} \end{document}المشكل المُصادف أنه منطقة تلاقي الإطار العمودي والأفقي لا تروقني، وهي الممثلة في الصورة أسفلة جهة اليسار:

كيف أحصل على شكل شبيه بالذي جهة اليمين؟
-
لا أدري هل هذا السؤال في محله أم لا، كنت أتساءل على بديل لأداة CAPATCH على أجهزة الموبايل، هل من أداة مخصصة لذلك؟
-
في العديد من المواقع، ألاحظ وجود بعص الأيقونات التي تتغير عند حدوث حدث ما، كمرور الفأرة مثلا ...
أريد السؤال عن التقنية المستعملة هنا؟
-
عند اسعمالي لجملة الاستعلام التالية على #C:
INSERT INTO tem (Telephone, Status, CreateDate) VALUES ('" + telephone + "','"+ status +"','" + DateTime.Now + "');
لكن أحصل على رسالة الخطأ :
The conversion of a varchar data type to a datetime data type resulted in an out-of-range value. The statement has been terminated.
ما الحل؟
-
أعمل على تطبيق بلغة #C، وأريد استخلاص قيمة IP العميل انطلاقاً من TcpClient، فهل هذا ممكن؟ وكيف ذلك؟
-
في كود بلغة php أتوفر على حلقة التكرار foreach التالية:
$itemArray = array(); foreach ($a->getDetails() as $b) { if ($b->getValue1() !== $b->getValue2()) { if (!array_key_exists($b->getId(), $itemArray)) { $itemArray[$b->getId()] = array('name' => $b->getName(), 'age' => $b->getAge()); } $personName = $itemArray[$b->getId()]['name']; $personAge = $itemArray[$b->getId()]['age']; $content = ('Name is: ' . $personName . ', age is: ' . $personAge); } }حيث أود تخزين بيانات على مصفوفة.
ثم عرض محتواها، لكن لا أدري لما لا يتم التخزين بشكل صحيح، كما يبين كود العرض:
array(1) { [0]=> object(PersonDetail)#322 (41) { ["collItemTemplateFieldPersonValues":protected]=> NULL ["id":protected]=> int(2375434) ["person_id":protected]=> int(2184229) ["person_details_id":protected]=> int(4563874) ["person_details_type_id":protected]=> NULL ["name":protected]=> string(4) "Test" ["person_namecode":protected]=> string(9) "PERSON_ID" ["person_age":protected]=> int(30)
ما الحل ؟
-
لدي الكود التالي:
\documentclass{beamer} \usepackage{tikz} \usetikzlibrary{shapes,positioning,automata,arrows.meta} \begin{document} \begin{frame}[t] \begin{tikzpicture}[overlay,remember picture, every state/.style={ellipse,draw=blue}] \node[state,xshift=3cm,yshift=-4cm,align=center] (q1) {A}; \node[state,align=center,right=3cm of q1] (q2) {B}; \path[draw=blue!50,very thick,arrows={- Latex[blue!50] %Stealth[length=11pt,open,round] % Computer Modern Rightarrow }] (q1) edge [above] node {\small 1} (q2); \path[draw=blue!50,very thick,arrows={- Latex[blue!50] %Stealth[length=8pt,open] }] (q1) edge [above,loop] node {\small 0} (q1); \end{tikzpicture} \end{frame} \end{document}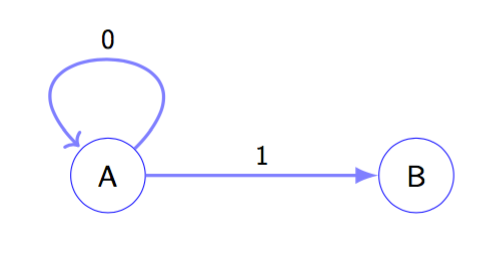
لماذا السّهمين مختلفي المنحى رغم أن لهما نفس الوظيفة؟
-
على وثيقة ببرنامج LaTeX، أود رسم الشكل المبين في الصورة :

لا أدري هل يمكنني فعل ذلك عن طريق pgf/tikz ؟
هل من توضيح؟
-
على برنامج LaTeX، أريد الحصول على جدول، حيث أمزج بعض الخانات بداخله وتصبح خانة واحدة، إليكم مثال:

لكن لم أستطع مزج خانات معينة، وهذا هو الكود :
\documentclass[a4paper]{report} \usepackage{multirow} \usepackage{array} \begin{document} \begin{table}[h] \begin{center} \renewcommand{\arraystretch}{2} \begin{tabular}{|m{2cm}|m{2cm}|m{3cm}|m{2cm}|m{2cm}|} \hline \multirow{2}*{text} & \multirow{2}*{text} & \multirow{2}*{text} & \multicolumn{2}{c|}{text}\\ \cline{1-3} 1 & 2 & 3 & 4 & 5\\ \hline \end{tabular} \end{center} \end{table} \end{document}لا أدري هل هذا ممكن على LaTeX أم لا؟
-
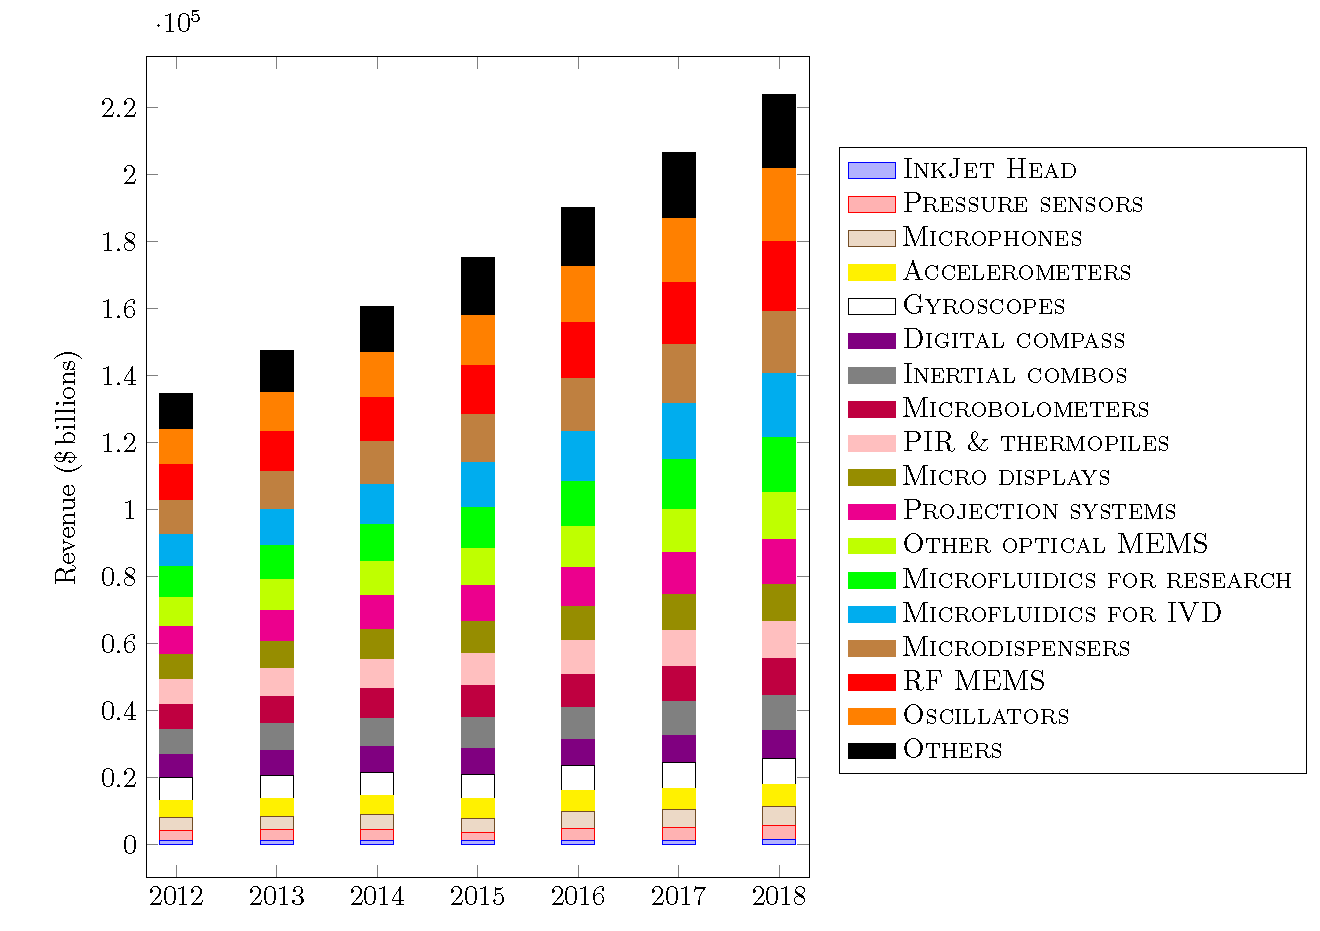
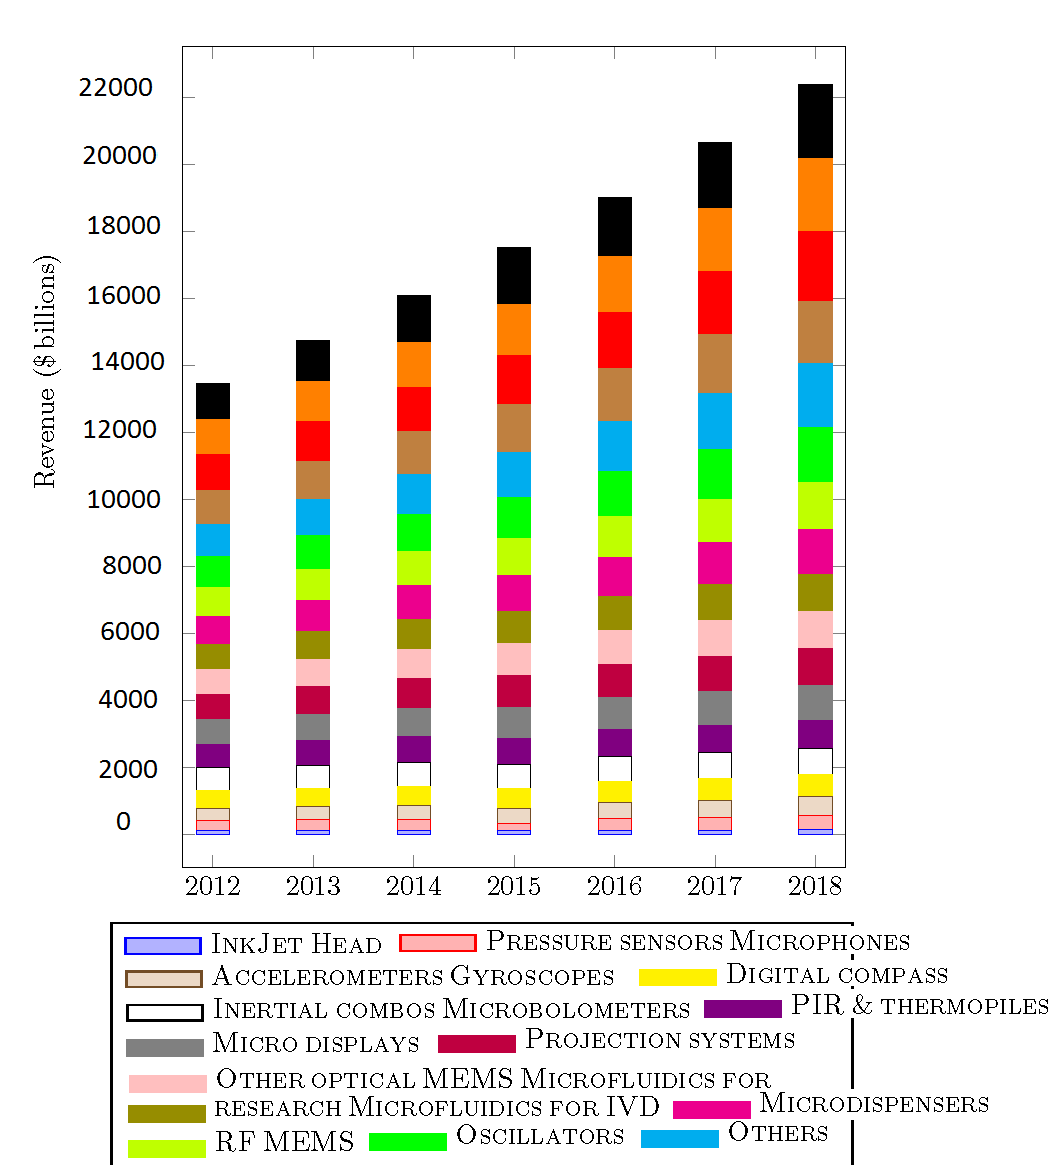
أنشأت مبيان على برنامج LaTeX بواسطة الكود التالي:
\begin{tikzpicture} \begin{axis}[ybar stacked, legend style={cells={anchor=west},at={(1.75,0.89)}}, area legend, %legend style={at={(1,-1)}, anchor=north,legend columns=-1,legend cell align=left}, x tick label style={ /pgf/number format/1000 sep=}, ylabel=Revenue (\$\,billions), enlargelimits=0.05,width=10cm,height=12cm, bar width=12pt, ] \addplot coordinates {(2012,1388) (2013,1388) (2014,1388) (2015,1388) (2016,1388) (2017,1388) (2018,1500)}; \addlegendentry{\textsc{InkJet Head}} \addplot coordinates {( 2012 , 2995 ) ( 2013 , 3144.75 ) ( 2014 , 3294.5 ) ( 2015 , 2126.45 ) ( 2016 , 3594 ) ( 2017 , 3893.5 ) ( 2018 , 4342.75 ) }; \addlegendentry{\textsc{Pressure sensors}} \addplot coordinates {( 2012 , 3594 ) ( 2013 , 3923.45 ) ( 2014 , 4193 ) ( 2015 , 4432.6 ) ( 2016 , 4792 ) ( 2017 , 5091.5 ) ( 2018 , 5450.9 ) }; \addlegendentry{\textsc{Microphones}} \addplot [color=yellow, fill=yellow] coordinates {( 2012 , 5361.05 ) ( 2013 , 5450.9 ) ( 2014 , 5690.5 ) ( 2015 , 5960.05 ) ( 2016 , 6289.5 ) ( 2017 , 6529.1 ) ( 2018 , 6738.75 )}; \addlegendentry{\textsc{Accelerometers}} \addplot [color=black, fill=white] coordinates {( 2012 , 6648.9 ) ( 2013 , 6888.5 ) ( 2014 , 7128.1 ) ( 2015 , 7188 ) ( 2016 , 7457.55 ) ( 2017 , 7637.25 ) ( 2018 , 7787 )}; \addlegendentry{\textsc{Gyroscopes}} \addplot [color=violet, fill=violet] coordinates {( 2012 , 6948.4 ) ( 2013 , 7337.75 ) ( 2014 , 7547.4 ) ( 2015 , 7727.1 ) ( 2016 , 7787 ) ( 2017 , 8086.5 ) ( 2018 , 8236.25 )}; \addlegendentry{\textsc{Digital compass}} \addplot [color=gray, fill=gray] coordinates {( 2012 , 7337.75 ) ( 2013 , 7906.8 ) ( 2014 , 8445.9 ) ( 2015 , 9164.7 ) ( 2016 , 9584) ( 2017 , 10033.25 ) ( 2018 , 10482.5 ) }; \addlegendentry{\textsc{Inertial combos}} \addplot [color=purple, fill=purple] coordinates {(2012,7487.5) (2013,8176.35) (2014,8835.25) (2015,9494.15) (2016,10033.25) (2017,10632.25) (2018,11021.6)}; \addlegendentry{\textsc{Microbolometers}} \addplot [color=pink, fill=pink] coordinates {( 2012 , 7547.4 ) ( 2013 , 8236.25 ) ( 2014 , 8850.225 ) ( 2015 , 9509.125 ) ( 2016 , 10048.225 ) ( 2017 , 10647.225 ) ( 2018 , 11081.5 ) }; \addlegendentry{\textsc{PIR \& thermopiles}} \addplot [color=olive, fill=olive] coordinates {( 2012 , 7562.375 ) ( 2013 , 8251.225 ) ( 2014 , 8865.2 ) ( 2015 , 9524.1 ) ( 2016 , 10063.2 ) ( 2017 , 10662.2 ) ( 2018 , 11096.475 ) }; \addlegendentry{\textsc{Micro displays}} \addplot [color=magenta, fill=magenta] coordinates {( 2012 , 8386 ) ( 2013 , 9134.75 ) ( 2014 , 10033.25 ) ( 2015 , 10886.825 ) ( 2016 , 11740.4 ) ( 2017 , 12608.95 ) ( 2018 , 13477.5 ) }; \addlegendentry{\textsc{Projection systems}} \addplot [color=lime, fill=lime] coordinates {( 2012 , 8685.5 ) ( 2013 , 9434.25 ) ( 2014 , 10332.75 ) ( 2015 , 11081.5 ) ( 2016 , 12129.75 ) ( 2017 , 12938.4 ) ( 2018 , 13926.75 ) }; \addlegendentry{\textsc{Other optical MEMS}} \addplot [color=green, fill=green] coordinates {( 2012 , 8985 ) ( 2013 , 10003.3 ) ( 2014 , 10931.75 ) ( 2015 , 12219.6 ) ( 2016 , 13417.6 ) ( 2017 , 14825.25 ) ( 2018 , 16472.5 ) }; \addlegendentry{\textsc{Microfluidics for research}} \addplot [color=cyan, fill=cyan] coordinates {( 2012 , 9823.6 ) ( 2013 , 10931.75 ) ( 2014 , 12129.75 ) ( 2015 , 13537.4 ) ( 2016 , 15124.75 ) ( 2017 , 16831.9 ) ( 2018 , 19018.25 ) }; \addlegendentry{\textsc{Microfluidics for IVD}} \addplot [color=brown, fill=brown] coordinates {( 2012 , 10123.1 ) ( 2013 , 11231.25 ) ( 2014 , 12579 ) ( 2015 , 14076.5 ) ( 2016 , 15723.75 ) ( 2017 , 17520.75 ) ( 2018 , 18419.25 ) }; \addlegendentry{\textsc{Microdispensers}} \addplot [color=red, fill=red] coordinates {( 2012 , 10482.5 ) ( 2013 , 11830.25 ) ( 2014 , 13327.75 ) ( 2015 , 14825.25 ) ( 2016 , 16622.25 ) ( 2017 , 18628.9 ) ( 2018 , 21114.75 ) }; \addlegendentry{\textsc{RF MEMS}} \addplot [color=orange, fill=orange] coordinates {( 2012 , 10542.4 ) ( 2013 , 11860.2 ) ( 2014 , 13447.55 ) ( 2015 , 14975 ) ( 2016 , 16921.75 ) ( 2017 , 19018.25 ) ( 2018 , 21564 ) }; \addlegendentry{\textsc{Oscillators}} \addplot [color=black, fill=black] coordinates {( 2012 , 10871.85 ) ( 2013 , 12279.5 ) ( 2014 , 13777 ) ( 2015 , 17071.5 ) ( 2016 , 17371 ) ( 2017 , 19617.25 ) ( 2018 , 22312.75 ) }; \addlegendentry{\textsc{Others}} %\legend{InkJet Head, Pressure sensors, Microphones, Accelerometers, Gyroscopes, Digital compass, Inertial combos, Microbolometers, PIR \& thermopiles, Micro displays, Projection systems, Other optical MEMS, Microfluidics for research, Microfluidics for IVD, Microdispensers, RF MEMS, Oscillators, Others} \end{axis}حيث يظهر مفتاح المبيان جانبه، هكذا:

وما أريده هو البحث عن طريقة تمكنني من جعله في الأسفل، هكذا:
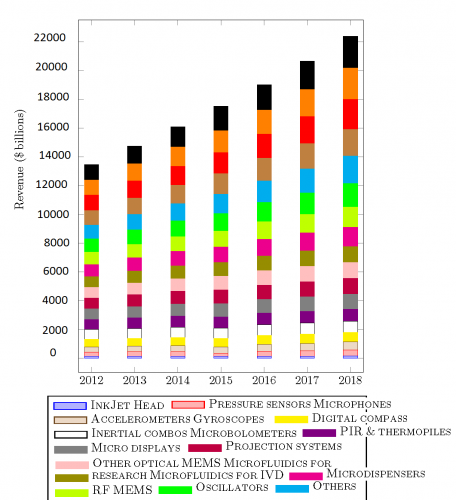
كيف ذلك؟
-
على تطبيق بلغة #C، بتقنية WPF، أودّ ملأ أداة Combobox بقيم مُستخرجة من ملف نصي.
حاولت فعل ذلك باستعمال الكود :
<ComboBox x:Name="serverTxt" Height="23" VerticalAlignment="Top" Text="{Binding Path=ServerNames}"/>
حيث مررت مسار الملف النصي إلى القائمة المُنسدلة، على أساس أنها ستقوم بإدراج قيمه كقيم لها.
الكود لا يعمل، فهل من حل لذلك؟
-
أريد ملأ DataSet انطلاقا من قاعدة بيانات Sql على تطبيق #C، من خلال الكود التالي:
الاتصال بقاعدة البيانات:
public static SqlCommand GetDbCommand(string sql) { if (dbconn.State.ToString().CompareTo("Open") != 0) Open(); if (dbCmd == null) { dbCmd = new SqlCommand(sql, dbconn); } dbCmd.CommandText = sql; return dbCmd; }
ملأ DataSet:
public static DataSet GetMovieSet() { DataSet movieSet = new DataSet(); string sql = "select * from Movie"; dbCmd = DBConnection.GetDbCommand(sql); SqlDataAdapter da = new SqlDataAdapter(); da.Fill(movieSet); DBConnection.Close(); return movieSet; }
الكود لا يعمل، فهل ينقصني أمر ما نسيت إضافته؟
-
أحاول استعمال تقنية Json للحصول على response انطلاقا من Servlet و صفحة JSP.
صفحة JSP:
<script> $(document).ready(function(){ $("#submitBut").click(function(){ var formData=getFormData(); var strUrl="rwcntrlr.do?action=loginForm"; $.post(strUrl, {jsonData: JSON.stringify(formData)},function(response){ response = jQuery.parseJSON( response); if(response.message=='not ok') { alert("not ok"); } else{ alert('OK'); } }); }); }); </script>
كود Servlet:
protected void doPost(HttpServletRequest request, HttpServletResponse response) throws ServletException, IOException { String formName=request.getParameter("action"); if(formName.equalsIgnoreCase("loginForm")){ String strJSONData = request.getParameter("jsonData"); System.out.println(strJSONData);// data received correctly... JSONObject jsonResponse = new JSONObject(); try{ JSONObject requestedJSONObject = new JSONObject(strJSONData); String login_name = requestedJSONObject.getString("login_name"); String password = requestedJSONObject.getString("password"); if(login_name.equalsIgnoreCase("mark")){ response.setContentType("application/json"); jsonResponse.put("status", "OK"); response.getWriter().write(jsonResponse.toString()); } else{ response.setContentType("application/json"); jsonResponse.put("status", "NOT OK"); response.getWriter().write(jsonResponse.toString()); } } catch(Exception ex){ ex.printStackTrace(); } } }النتيجة هي أني أستطيع الحصول على Form المُرسلة، لكن لا أستطيع إظهار البيانات، ولا أدري كيف أحل هذا المشكل؟
-
لا أدري أي الرأيين هو الصائب، فالبعض يقول أن امتحان نيل شهادة +Linux هو بالأمر الصعب، وقد يطول، بينما الرأي الآخر عكس ذلك ,انها شهادة كشهادة CompTIA، هل من توضيح في هذا الباب؟ وهل الإعداد لها يحتاج إلى مدة أطول؟
-
أريد الاستفسار حول أي الشهادتين التاليتين أسهل من حيث الدراسة ويُسر الحصول عليه، هل هي MCSA Server 2012 أم Cisco CCNA R/S؟
-
مع حلول سنة2016 أريد السؤال عن جديد شهادة CompTIA A+ 220-901 وَ كذا 220-902 ، هل هناك أي جديد بخصوص هذه الشهادات، أم هي على حاله؟
-
أريد تعلم بيئة العمل Linux وأخص بالذكر أني لم اعمل عليها من قبل، فهل لي بسلسلة تعليمية على شكل فيديوهات للمبتدئين أستفيد منها؟
-
أعتقد أن الأمر جد سهل على بيئة العمل ويندوز لكن بالمقابل أجد صعوبة في إبطال مفعول وعمل TCP/IP من خلال واجهة الإعدادات على لينكس، فكيف ذلك؟
*هذا سؤال وجدته في إحدى سلسلات الأسئلة.
-
بعد الاستعداد المتواصل لمدة 6 أسابيع، وبشكل يومي لنيل شهادة ICND1، فهل أجد كتاب متخصص في هذه الشهادة ، أجد فيه أمثلة للأسئلة المطروحة في مثل هذا الامتحان؟


كيف أغير PictureBox عن طريق الضغط على زر داخل تطبيق بـ Vb.Net؟
في أسئلة البرمجة
نشر
هذا الكود مسؤول عن تغيير PictureBox عن طريق الضغط على زر داخل تطبيق بـ Vb.Net:
Private Sub btn5_Click(sender As Object, e As EventArgs) Handles btn5.Click, btn7.Click, btn9.Click
        'PictureBox1.Location = [What should I type here].Location

    End Sub
لكنه لا يعمل؟